Figure 1.
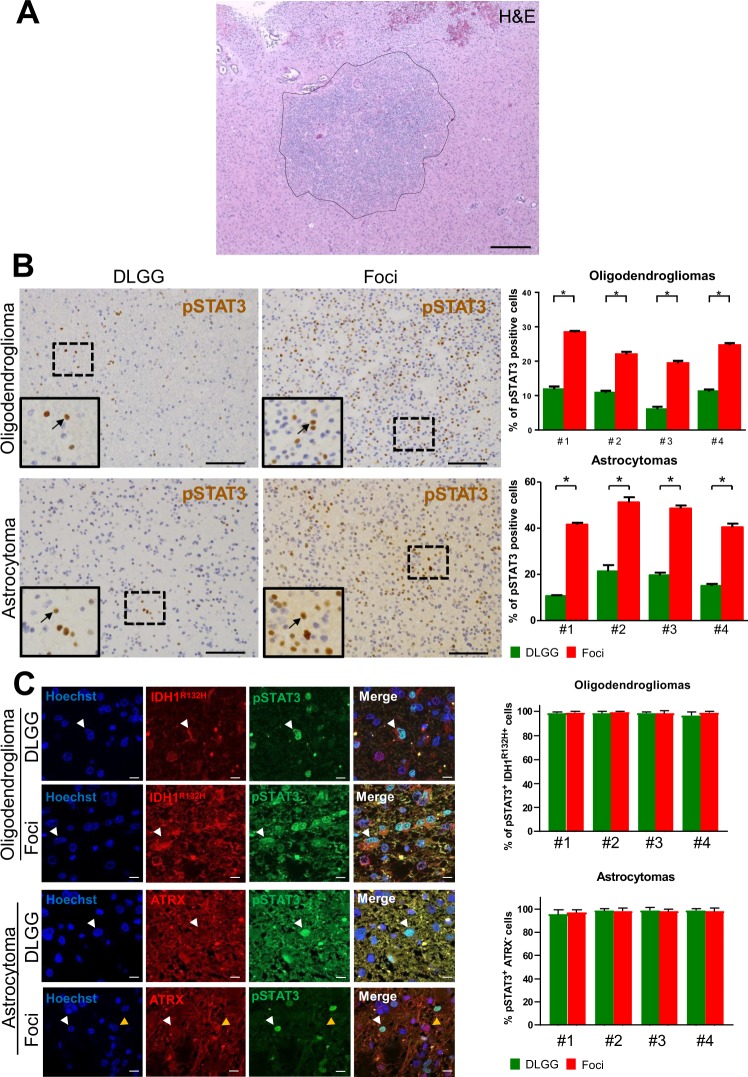
pSTAT3 stainings in diffuse low-grade glioma foci. (A) Example of a high cell density foci detected in a diffuse low-grade glioma. H&E: hematoxylin and eosin stainings. Scale bar 500 μm. (B) Representative stainings for pSTAT3 in diffuse low-grade gliomas. Left and right-hand images are taken outside and inside the foci, respectively. Images taken in an oligodendroglioma (upper images) and an astrocytoma (lower images) are presented. Arrows point to pSTAT3+ cells in each inset. Scale bars 150 μm. Quantification of pSTAT3+ cells detected in 5 fields (10,000 μm²) outside and inside the foci in 4 oligodendrogliomas and 4 astrocytomas are presented on the right-hand side. Test = Mann-Whitney tests n = 5, p value = 0.011 for oligodendrogliomas and astrocytomas. (C) Expression of pSTAT3 by tumoral cells. Representative photographs of double immunofluorescences for IDH1R132H/pSTAT3 and ATRX/pSTAT3 in one grade II oligodendroglioma and one grade II astrocytoma, in and outside the foci. White arrows point to IDH1R132H+/pSTAT3+ (oligodendroglioma) and ATRX negative/pSTAT3+ (astrocytoma) cells. The yellow arrow on astrocytoma photograph indicates one example of an ATRX+ cell to show the quality of the immunofluorescence. Right-hand histograms show the percentage of tumoral pSTAT3+ cells (e.g. pSTAT3+ cells which are positive for IDH1 R132H or negative for ATRX) outside and inside the foci assessed by IDH1R132H/pSTAT3 and ATRX/pSTAT3 co-stainings in 4 oligodendrogliomas and 4 astrocytomas (5 fields (10,000 μm²) outside and inside the foci quantified per patient). Only cells with obvious nuclear pSTAT3 staining were counted.

