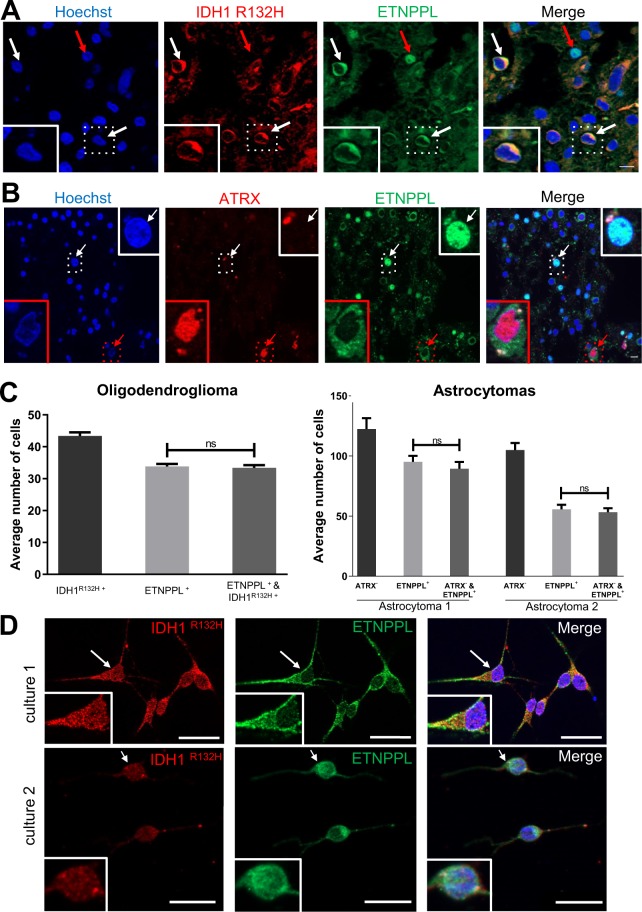
Figure 5.
Expression of ETNPPL by tumoral cells. (A) Representative photograph of double immunofluorescence for IDH1R132H/ETNPPL in one grade II oligodendroglioma. White arrows point to IDH1R132H positive tumour cells co-expressing ETNPPL in the cytoplasm (green). Red arrow points a nuclear ETNPPL expression in a non tumoral cell (IDH1R132H negative) indicative of staining specificity. Scale bars 10 μm. (B) Representative photograph of double immunofluorescence for ATRX/ETNPPL in one grade II astrocytoma. Most of ETNPPL+ cells do not express ATRX and are thus tumoral. The red arrow points to an ETNPPL+ ATRX+ cell which is unlikely to be tumoral whereas the white arrow shows an ETNPPL+ ATRX- tumoral cell. Insets are high magnification of pointed cells. Scale bars 10 μm. (C) Quantification of tumoral ETNPPL+ cells. Histograms show the average number of indicated cells by counted field (x40) in one grade II oligodendrogliomas and two grade II astrocytomas. In oligodendroglioma, ETNPPL+ cells are also IDH1 R132H+ whereas in the two astrocytomas they are ATRX-. Tests = Mann-Whitney tests are non-significant (n.s.) p = 0.74; 0.55; 0.53 for the 3 tumours. (D) Detection of ETNPPL (green) in 2 diffuse low-grade gliomas cultures. The presence of tumoral cells is indicated by staining for the mutated IDH1 R132H protein (red). Insets are high magnification of cells pointed with arrows. Note that in those two patients, the ETNPPL protein was mainly detected in the cytoplasm. Scale bars = 20 μm.

