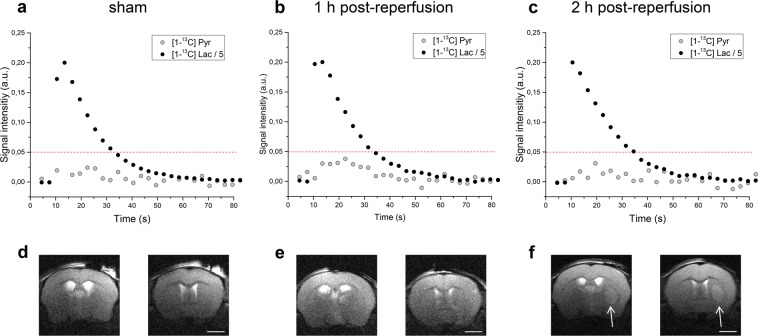
Figure 2.
Representative in vivo time courses of [1-13C] lactate (black) and its metabolic product [1-13C] pyruvate (grey) in the brain of sham operated mice (a) and of mice at different times after ischaemia onset (b,c). Each time course was normalised to the respective maximal lactate signal. The red dotted line was added to highlight the differences in [1-13C] pyruvate labelling. The corresponding T2W axial images of the brains of sham operated mice (d) and mice at different time points after ischaemia onset (e,f) are presented at the bottom of each time course. While a clear lesion can be detected 2 h post-reperfusion (f, white arrow), the morphological modifications are still obscured at 1 h post-reperfusion (e). Images acquired ca. 5 min before the infusion of HP [1-13C] lactate, showing two axial slices out of 14 one mm thickness slices. Other experimental parameters: effective echo time and repetition time: TEeff/TR = 52/4000 ms, 2 scans, 18 mm × 18 mm FOV with matrix size 256 × 256. Scalebar: 2 mm.

