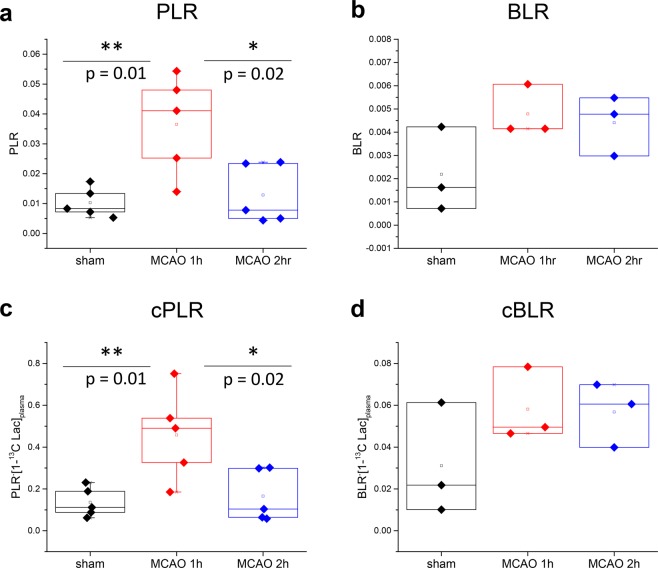
Figure 3.
(a,c) Pyruvate-to-lactate ratios (PLR) and ratios corrected for [1-13C] lactate concentration in blood at the time of injection (cPLR), overlaid with individual data points. One-way ANOVA test indicates significant statistical difference (p < 0.05) between both PLR and cPLR 1 h post-reperfusion (red) and sham (black) and 2 h post-reperfusion (blue). The average values for cPLR were 0.46 ± 0.21, 0.17 ± 0.12 and 0.14 ± 0.07 in MCAO mice 1 h and 2 h post-reperfusion and sham respectively. (b,d) Bicarbonate-to-lactate ratios (BLR) and ratios corrected for [1-13C] lactate concentration in blood at the time of injection (cBLR) overlaid with individual data points showing a trend for increased BLR and cBLR in MCAO mice 1 h (red) and 2 h post-reperfusion (blue) compared to sham (black). The average values for cBLR were 0.058 ± 0.018, 0.057 ± 0.015 and 0.031 ± 0.027 in MCAO mice 1 h and 2 h post-reperfusion and sham respectively.

