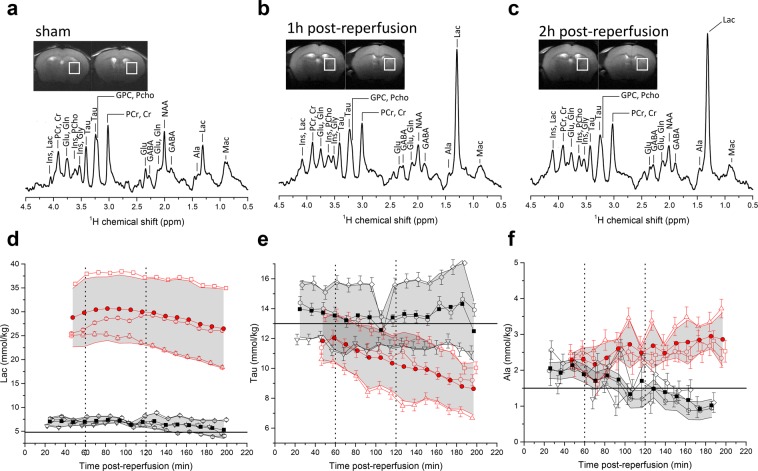
Figure 4.
(a–c) Representative 1H spectra and voxel position in the striatum of sham mice and MCAO mice 1 h and 2 h post-reperfusion. (d–f) Time course of selected metabolites after 30 min MCAO surgery (red) and sham operated mice (black); time zero indicates the beginning of reperfusion. Open symbols are individual animals, with Cramer-Rao lower bounds (CRLB) of the LC-model quantification as error bars. Full red circles are the average of all three MCAO animals and full black squares are the average of all three shams -with the grey area representing the corresponding standard deviation. Horizontal lines that designate the metabolite concentration in healthy 8-week C57BL6/J mice as reported by Tkac et al.49 were added to guide the eye on the dynamic evolution of the metabolite concentrations. Vertical lines indicate the times at which HP lactate was injected in the HP 13C MRS measurements.

