Figure 5.
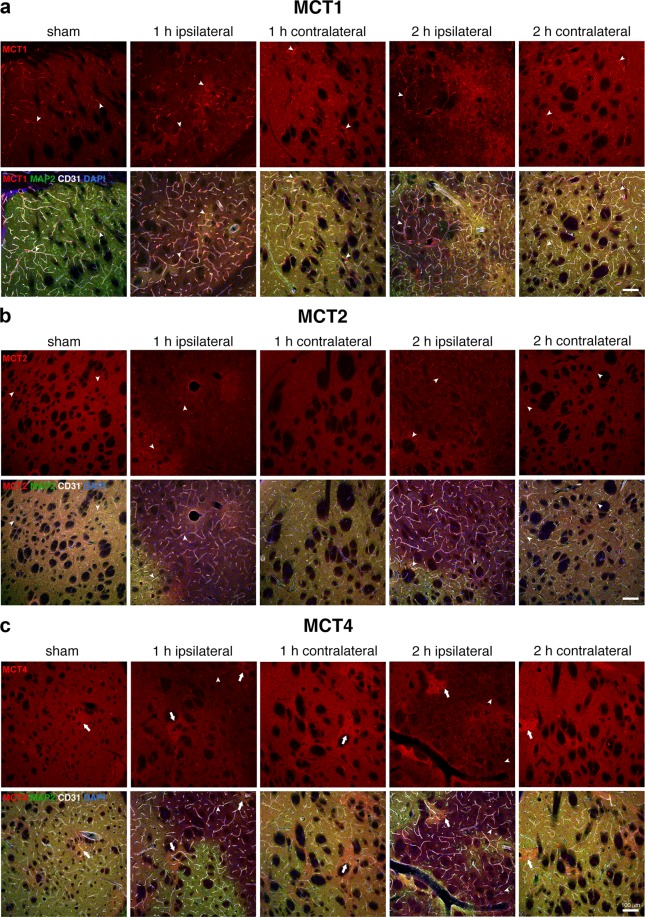
Changes in MCT expression patterns after ischaemia-reperfusion. The images in red in the upper panels show the expression of lactate transporters MCT1 (a), MCT2 (b) and MCT4 (c) in the striatum of sham animals and in the striatum ipsilateral and contralateral to the lesion of MCAO mice at 1 h or 2 h post-reperfusion. The lower panels show the merged images of the triple immunolabelling of the MCTs (red) with the neuronal marker MAP-2 (green) to identify the lesion area (i.e. loss of MAP-2 staining), the endothelial cell marker CD31 to identify blood vessels (grey) and the nuclear counterstaining (DAPI, blue). Arrowheads indicate blood vessels. Arrows in (c) indicate patches of high MCT4 expression. Scalebar: 100 μm.

