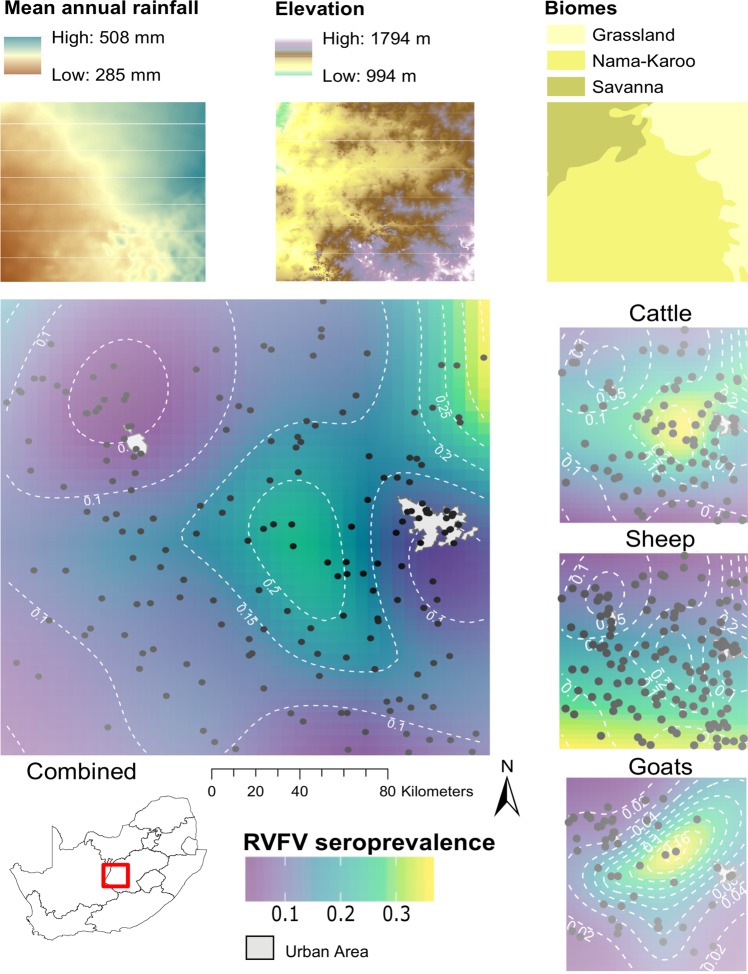
Figure 2.
Geographic distribution of RVFV seropositivity across the study area in all unvaccinated livestock, and in cattle, sheep and goats, produced using a generalized additive model with a Gaussian process basis function. Black dots indicate sampling locations; grey areas demarcate major urban and suburban areas (Bloemfontein and Kimberley). Top panels show mean annual rainfall, elevation above mean sea level and major biomes for the study area. The map was constructed for this publication in Esri ArcGIS 10.2 (https://www.esri.com) and R version 3.5.166, using the packages “ggplot2”, “gridExtra”, “rgdal”, “sp”, “raster”, “metR”, “ggspatial” and “viridis” (https://cran.r-project.org/web/packages/) and assembled in Inkscape 0.92 (https://inkscape.org), using country and province boundaries, rainfall and elevation data from Esri ArcGIS Online (https://www.esri.com/en-us/store/arcgis-online), biome and urban area data (https://africaopendata.org) available under a Creative Commons Attribution (CC BY 4.0) license, and coordinates recorded on the farms during the study.

