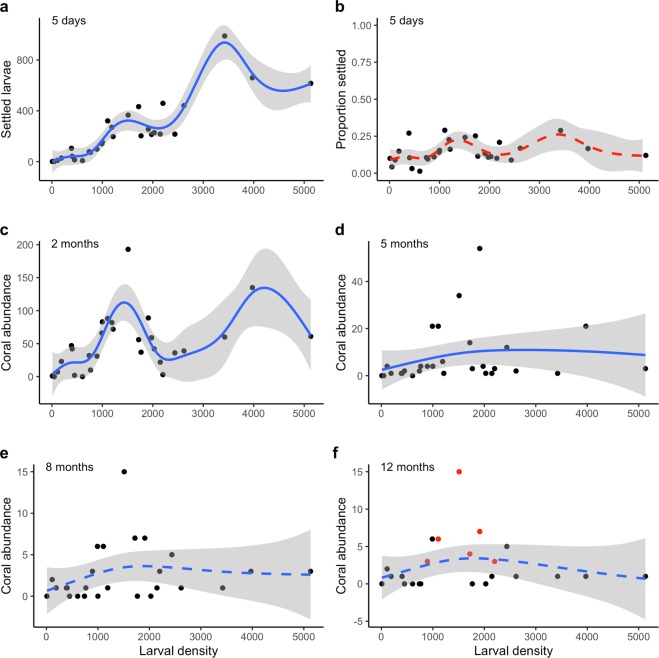
Figure 2.
Relationship between larval density and initial settlement and colony abundance during the first 12 months: (a) total A. tenuis settlement after five days, (b) proportion of larvae settled (%) after five days, (c) post-settlement colony abundance after 2 months, (d) colony abundance after 5 months, (e) after 8 months, and (f) after 12 months, with visibly fusing colonies highlighted with red data points. Solid lines indicate significant model fits, dashed lines represent non-significant model fits, and shaded areas represent 95% confidence intervals.

