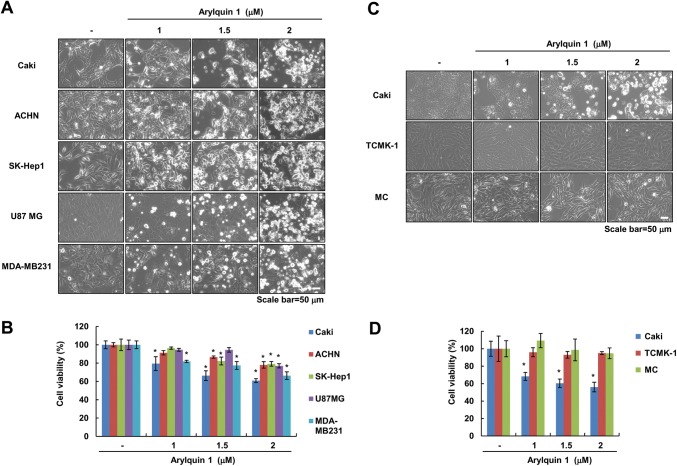
Fig. 1.
Arylquin 1 induces cell death in various cancer cells. a–d Cells were treated with the indicated concentrations of arylquin 1 for 24 h. Cell morphology was examined using interference light microscopy (a, c). Cell viability was determined using the XTT assay (b, d). The values in b, d represent the mean ± SEM from three independent samples. *p < 0.05 compared to the control. SEM standard error of the mean

