Fig. 2.
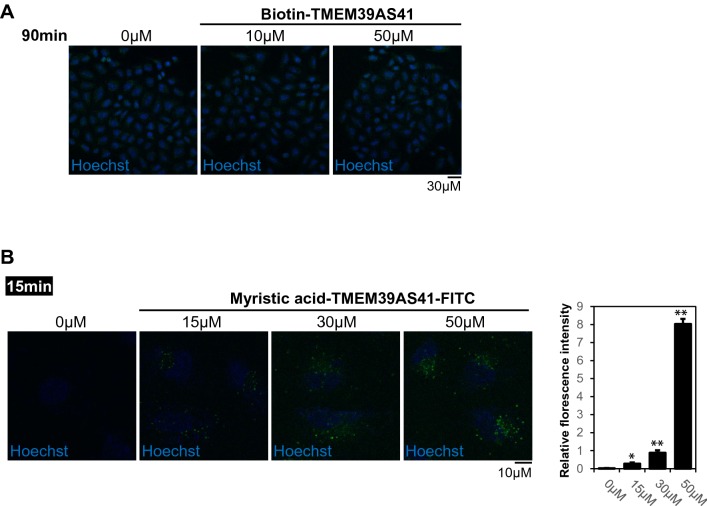
Myristic acid conjugation enhances the intracellular uptake capacity of the TMEM39AS41 peptide. a Representative CLSM images of alexafluor 488 conjugated peptides (0, 10, or 50 μM) in A549 cells. Indicated peptides were treated in A549 cells for 90 min. The green fluorescence indicates intracellular uptake of peptides. Hoechst 33342 (DNA stain). Scale bar, 30 μm. b Representative CLSM images of FITC conjugated peptides (0, 15, 30, or 50 μM) in A549 cells. Indicated peptides were treated in A549 cells for 15 min. The green fluorescence indicates intracellular uptake of peptides. Hoechst 33342 (DNA stain). Scale bar, 10 μm. (Left panel). Relative and statistical differences of fluorescence intensity were plotted. Data are expressed as the mean ± SE of three independent experiments (*p > 0.05, **p > 0.01) (Right panel)

