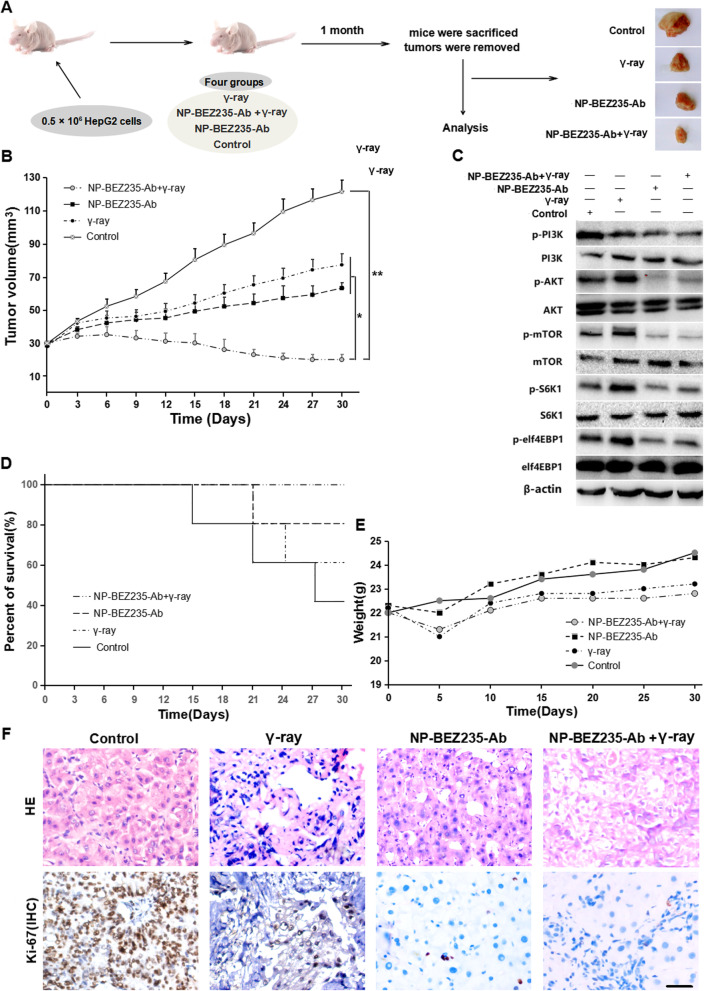
Fig. 10.
NP-BEZ235-Ab enhanced the radiosensitivity of HCC cells in vivo. a Schematic diagram of the animal experimental process. b Xenograft tumor volume curves for different treatment groups within 30 days of treatment. c Differential expression of PI3K/AKT/MTOR signaling pathway and downstream molecules P70S6K and elf4EBP1 in tumor tissues of each treatment group detected by Western blot. d Survival curves of tumor-bearing mice in different treatment groups within 30 days of treatment (n = 5). e Body weight change curves of xenograft tumor-bearing mice in different treatment groups within 30 days of treatment. f H&E staining of xenograft tumors of different treatment groups and IHC staining of Ki-67 (scale bar = 50 μm)

