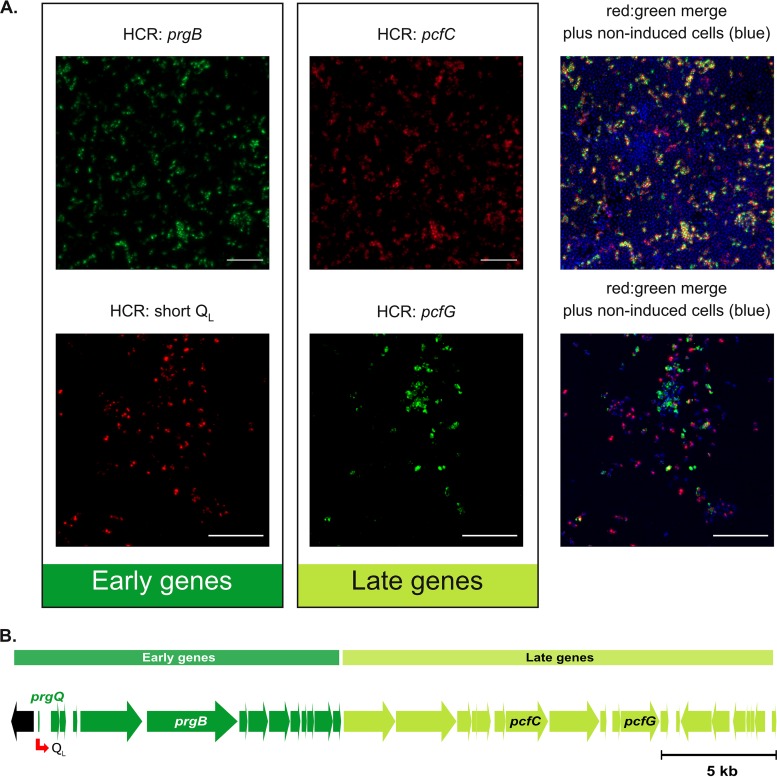
FIG 5.
Induced E. faecalis cells that express early induced transcripts also express late induced transcripts. (A) E. faecalis OG1RF/pCF10 was harvested for HCR labeling at 30 min after addition of 2.5 ng · ml−1 C. Green and red, transcripts labeled by HCR with Alexa Fluor 488 and Alexa Fluor 647, respectively; blue, nucleic acids (primarily DNA) labeled with Hoechst 33342 highlight individual cells. (Top) Induced prgB (green, early gene) and pcfC (red, late gene) HCR-labeled transcripts. (Bottom) Induced pcfG (green, late gene) and QL (red, early gene) HCR-labeled transcripts. Bars, 10 μm. (B) Schematic showing the distances between the genes whose transcripts were probed using HCR. See Fig. 1 for a more complete map. Not shown is a control experiment in which an identically induced aliquot of donor cells was subjected to HCR analysis for both QL and pcfG expression but where the fluorophores used for detection were swapped; the fractions of positive cells for each transcript were not detectably different from those shown in the images in the lower part of panel A.

