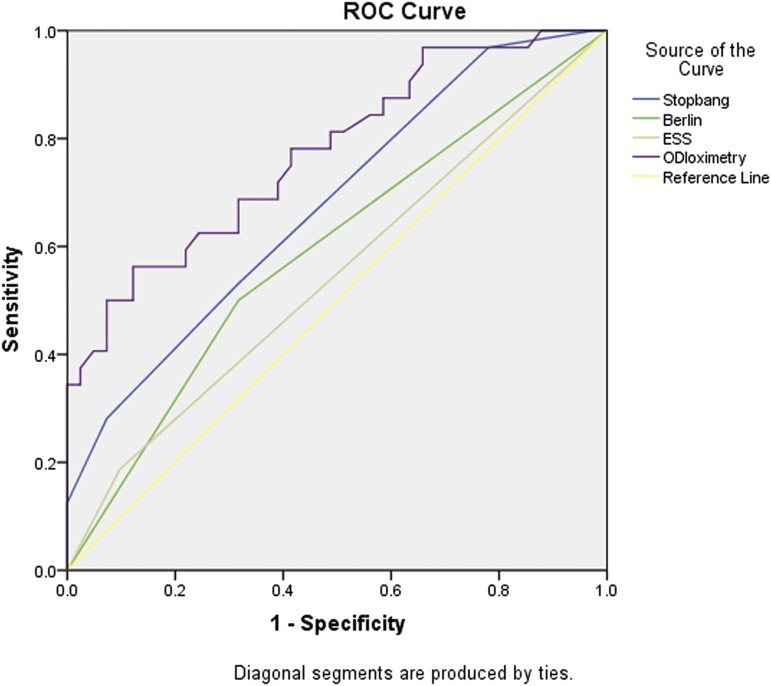
Figure 1. ROC curves for detection of obstructive sleep apnea in chronic obstructive pulmonary disease.
The AUC of oximetry (0.77, 95% CI 0.67–0.88, P < .001) was higher than that of the STOP-BANG (0.68, 95% CI 0.56–0.80, P = .009) and Berlin (0.59, 95% CI 0.46–0.72, P = .182) questionnaires and the ESS (0.55, 95% CI 0.41–0.68, P = .512). AUC = area under the curve, ESS = Epworth Sleepiness Scale, ODI = oxygen desaturation index, ROC = receiver operating characteristic.

