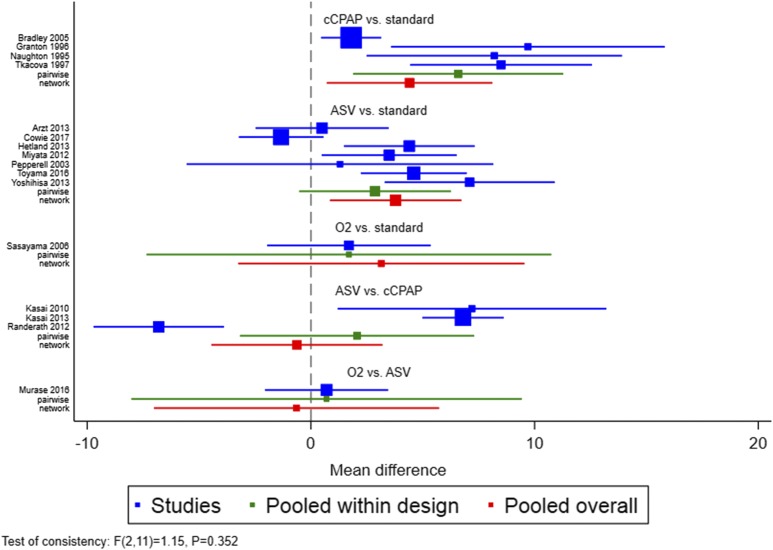
Figure 3. Forest plot.
Forest plot showing the results of the pairwise and network meta-analyses in each of the five comparison groups. Box sizes are proportional to the weight of each study in the random-effects meta-analysis. ASV = adaptive servoventilation, cCPAP = constant coninuous positive airway pressure, O2 = nocturnal oxygen, standard = inactive control.

