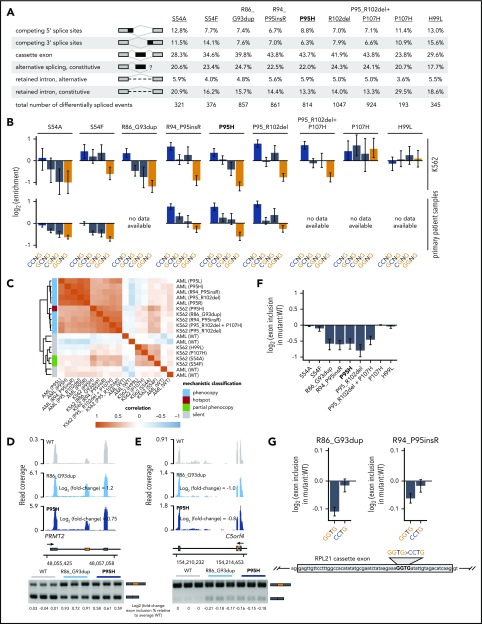
Figure 2.
Rare mutations in SRSF2 alter exonic splicing enhancer (ESE) preference. (A) Differentially spliced events identified in K562 cells expressing each indicated SRSF2 mutant allele relative to WT-expressing control cells. Percentages represent the distribution of differentially spliced events among the indicated event types for each mutation. (B) Enrichment for each indicated variant of the SSNG motif within cassette exons that were promoted vs repressed in cells expressing mutant vs WT SRSF2. The enrichment for a given motif was defined as the number of instances in all promoted exons divided by the number of instances in all repressed exons. Error bars represent 95% confidence intervals estimated by bootstrapping. The transcriptomes of patient samples bearing SRSF2S54A (polycythemia + hyperleukocytosis + myelofibrosis) and SRSF2S54F (chronic myelomonocytic leukemia) were sequenced for this study; RNA-seq data from patient samples bearing SRSF2R94_P95insR (AML), SRSF2P95H (chronic myelomonocytic leukemia), and SRSF2P95_R102del (AML) were previously published.20 (C) Heat map and dendrogram illustrating the global similarity of splicing programs in K562 cells and AML samples expressing the indicated alleles of SRSF2. Dendrogram illustrates the results of an unsupervised clustering based on differential splicing in each indicated sample relative to WT-expressing control cells (K562) or a median computed over all WT samples (AML). AML patient data were previously published.20 (D) RNA-seq read coverage illustrating increased cassette exon inclusion in PRMT2 in K562 cells expressing either a hotspot (P95H) or private (R86_G93dup) SRSF2 mutation (top). Log2 (fold-change) illustrates log2 (exon inclusion in mutant- vs WT-expressing cells). RT-PCR validation of RNA-seq results in technical triplicate (bottom). Log fold-changes for RT-PCR computed with respect to the mean signal for WT. (E) As in panel (D), but for a cassette exon in C5orf4 that is repressed by mutant SRSF2. (F) Relative inclusion of a cassette exon within RPL21 expressed from its endogenous locus in K562 cells expressing mutant vs WT SRSF2. Error bars represent 95% confidence intervals for the relative inclusion ratio, computed by propagating the 95% confidence intervals for the 2 isoforms to the ratio for mutant vs WT SRSF2 by standard rules for error propagation during division of quantities with individual errors. (G) As in panel (F), but where the RPL21 cassette exon is expressed from a minigene transfected into K562 cells and contains the indicated ESEs. GGTG is the native sequence; CCTG is a mutated ESE that is predicted to be well-recognized in the presence of mutant SRSF2. Bars represent the mean ± standard deviation, measured by quantitative RT-PCR and computed over 3 biological replicates.

