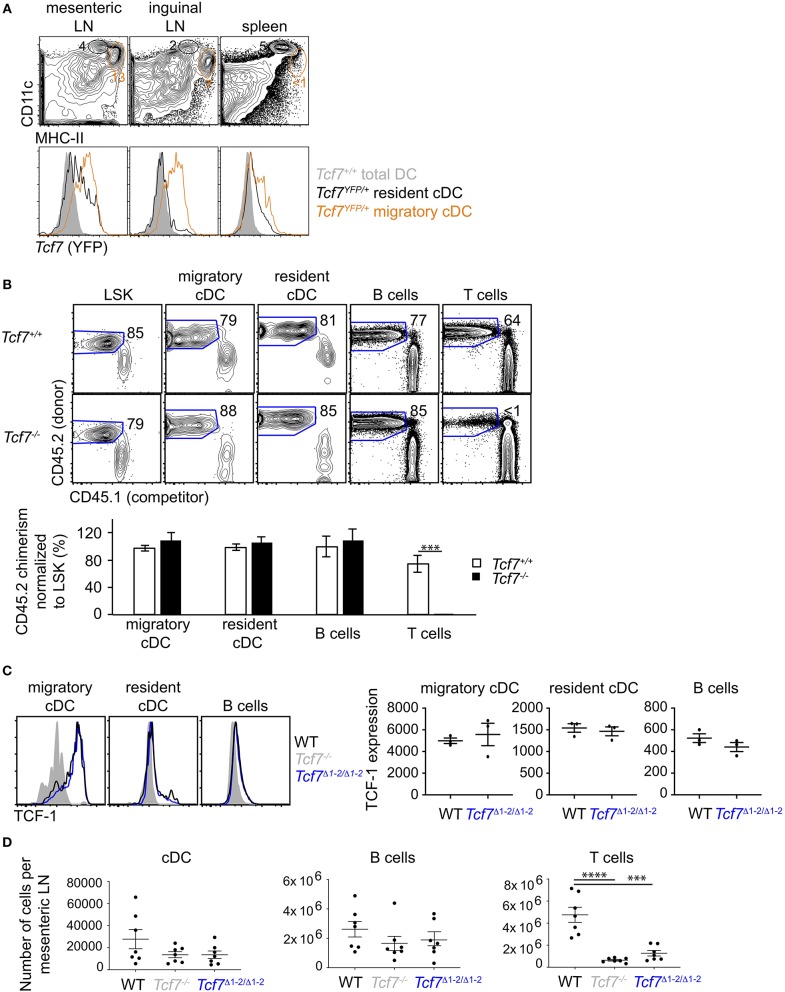
Figure 4.
The region 1–2 is not required for TCF-1 expression in migratory cDC. (A) Flow cytometric analysis of spleen and LN from Tcf7YFP/+ and WT mice. Plots are gated on TCR−CD19− cells and show CD11chiHMCIIlo resident cDCs (black) and CD11cloHMCIIhi migratory cDCs (orange) (top), and their Tcf7 (YFP) expression compared to total DC (gray) in Tcf7+/+ mice. (B) Flow cytometric analysis of long-term hematopoietic competitive chimeras reconstituted with LinBM− BM cells from Tcf7−/− or WT CD45.2+ littermates mixed with CD45.1+ LinBM− BM cells (3:1 ratio). LSK are from the BM, migratory and resident cDC, B cells and T cells are analyzed in the mesenteric LN. Representative flow plots are shown (top). Data are presented are average +/– SEM for 12 Tcf7+/+ and 11 Tcf7−/− chimeric mice pooled from three independent experiments (bottom). A two-tailed Student's t-test was used to determine significance. ***p < 0.005. (C) Flow cytometric analysis of TCF-1 protein expression in migratory and resident cDC, and B cells from mesenteric LN of Tcf7Δ1−2/Δ1−2, Tcf7−/−, and WT mice. Representative flow plots are shown (left). Data are presented as average of TCF-1 gmfi +/– SEM for n = 3 mice analyzed in one experiment (right). A two-tailed Student's t-test was used to determine significance. Data are representative of three independent experiments. (D) Flow cytometric analysis of mesenteric LN cells quantifying cDCs, B cells, and T cells. Data are presented as average +/– SEM for 7 mice of each genotype pooled from three independent experiments. A two-tailed Student's t-test was used to determine significance. ***p < 0.001, ****p < 0.0001.

