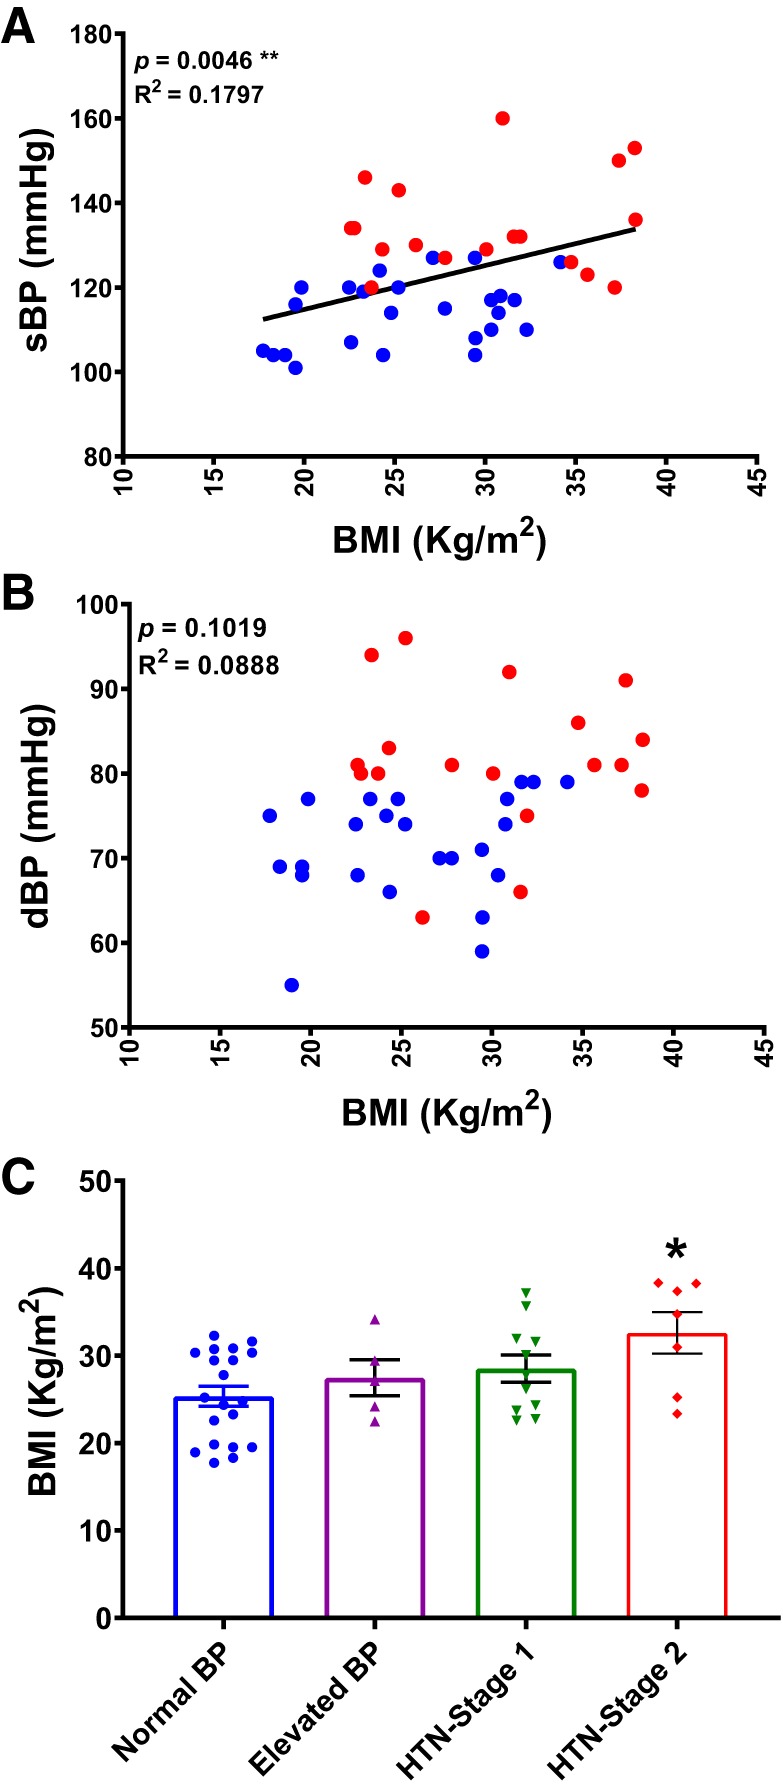
Fig. 3.

Elevated BP in hypertensive participants. Correlation of sBP (A) and dBP (B) with body mass index (BMI) (n = 43). **P < 0.01; linear regression. C: BMI of study subjects. Normal BP, n = 20; elevated BP, n = 5; HTN-stage 1, n = 11; HTN-stage 2, n = 7; *P < 0.05, versus normal BP group; one-way ANOVA with Bonferroni post hoc tests.
