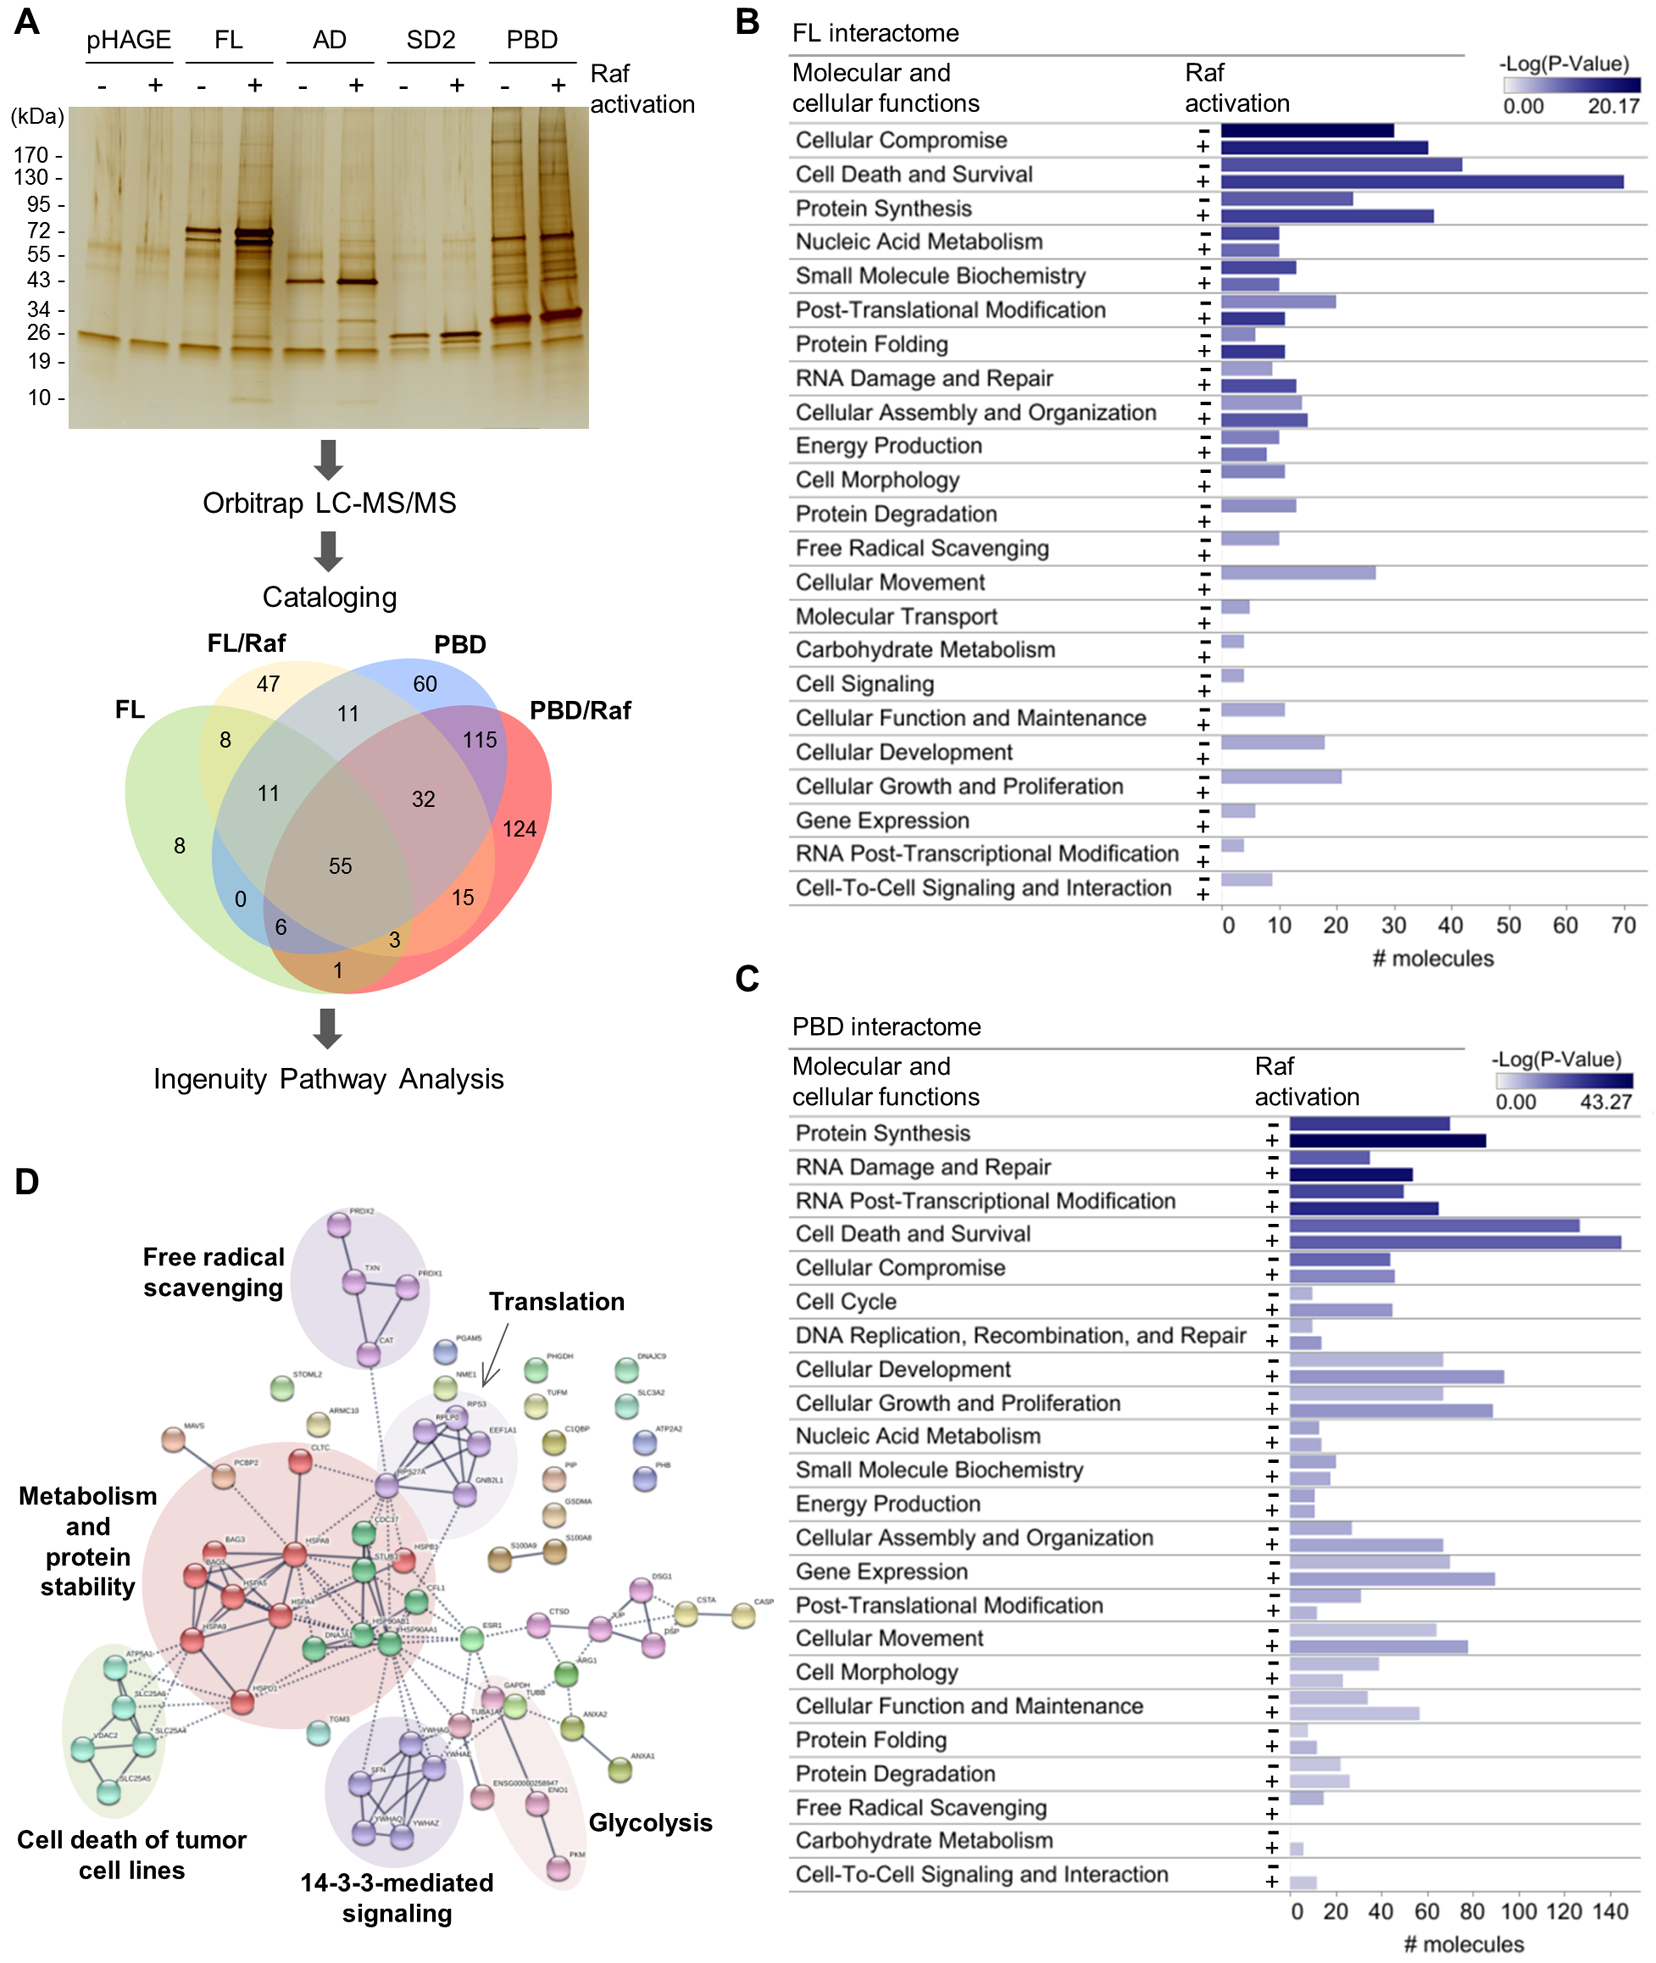
Figure 3. Proteomic analysis identifies MPTP components in mortalin interactome.

(A) Schematic of the proteomic analysis. Immunoprecipitates of the HA-tagged mortalin domain mutants from LNCaP-Raf:ER cells, after or without 4-hydroxytamoxifen (4-HT; 1 μM) treatment for 48 hours, were separated and visualized by SDS-PAGE and silver staining. Protein bands were excised, digested, and analyzed by LC-MS/MS using the instrument settings and search parameters in table S1. Identified proteins are cataloged in data file S1. Proteins in each sector of the Venn diagram are listed in data file S2. The screening in SK-MEL-28 is presented in fig. S10, A and B. Silver-stained SDS-PAGE image is representative of two independent samples. (B and C) Functional classification by IPA of the proteins identified from the interactomes of full-length mortalin (B) and PBD (C) reveal proteins in cell death and survival networks as a major constituent in the interactomes. # molecules indicate the number of different proteins in each functional category. IPA summary is shown in Comparison with SK-MEL-28 data is presented in fig. S10C. (D) STRING analysis of the cell death and survival protein networks of full-length mortalin interactome in Raf:ER-activated LNCaP cells. Edge intensity indicates the confidence of association between nodes. Nodes were clustered using MCL algorithm. Inter-cluster edges are represented by dashed-lines. Noted is the presence of ANT and VDAC in the “cell death of tumor cell lines” cluster in this network. Additional analysis is shown in fig. S10, D to F.
