Fig. 1.
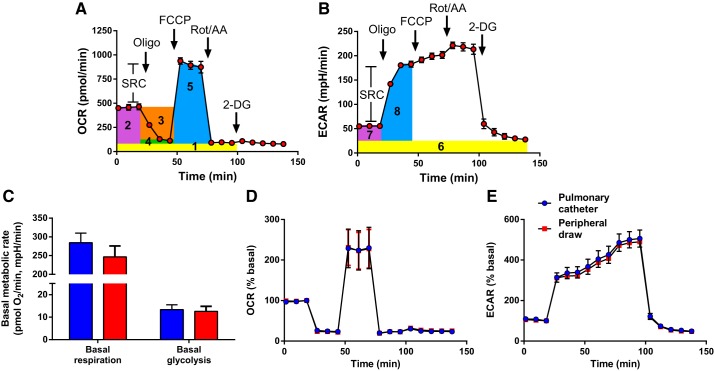
Representative data from Seahorse Extracellular Flux Assay. A and B: platelets were seeded at 50 × 106/well, and graphs show means ± SD of 4 replicate wells of oxygen consumption rate (OCR; A) and extracellular acidification rate (ECAR; B) from 1 female dyspnea patient. Arrows show sequential injections of oligomycin, FCCP, rotenone/antimycin A, and 2-deoxy-d-glucose (2-DG). Height of rectangles illustrates how we calculated metabolic parameters. In A, yellow 1 is nonmitochondrial respiration, purple 2 is basal respiration, orange 3 is ATP-linked respiration, green 4 is proton leak, and blue 5 is maximal respiration. Bar between maximal and basal respiration represents spare reserve capacity (SRC) of respiration. In B, yellow 6 is nonglycolytic acidification, purple 7 is basal glycolysis, and blue 8 is maximal glycolysis. Bar between maximal and basal glycolysis represents SRC of glycolysis. C–E: platelet metabolism is not altered by the collection techniques used in this study.

