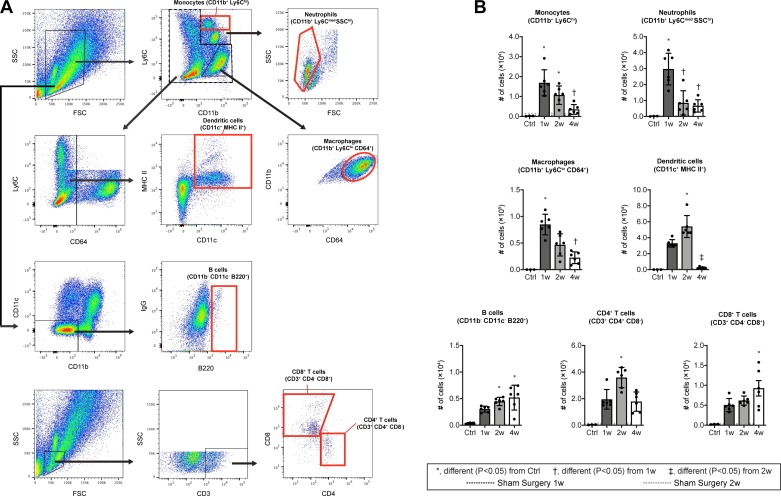
Fig. 3.
Flow cytometry of immune cell populations in Achilles tendons after tenotomy and repair. A: dot plot demonstrating gating strategies. B: quantification of populations of monocytes (CD11b+/Ly6Chi), neutrophils (CD11b+/Ly6Cmed/SSChi), macrophages (CD11b+/Ly6Clo/CD64+), dendritic cells (CD11c+/MHC II+), B cells (CD11b−/CD11c−/B220+), CD4+ T cells (CD3+/CD4+/CD8−), and CD8+ T cells (CD3+/CD4−/CD8+) from Achilles tendons. Mean values of sham-operated mice at 1wk (dark gray) or 2 wk (light gray) are shown as horizontal dotted lines but are not directly included in the statistical model. Differences between groups tested were obtained using a one-way ANOVA (α = 0.05) followed by Bonferroni post hoc sorting, as well as the Kruskal-Wallis test followed by Dunn’s multiple comparisons test. *Significantly different, P < 0.05, from control (Ctrl). †Significantly different, P < 0.05, from 1 wk. ‡Significantly different, P < 0.05, from 2 wk. n ≥ 3 mice per control or surgical time point.

