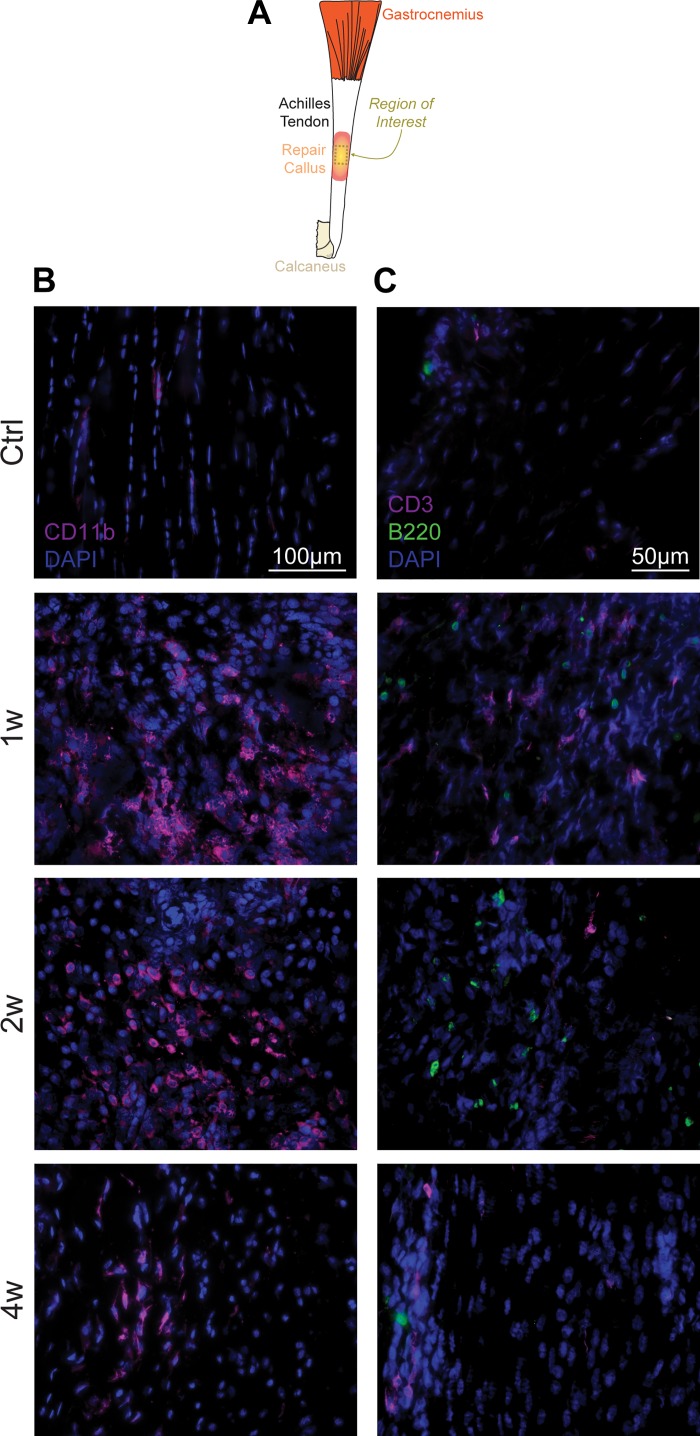
Fig. 4.
Location of immune cells in injured tendons. A: overview of the region of interest for B and C, which is taken from the midsubstance of the Achilles tendon. In the groups that underwent a tenotomy and repair, this region was in the callus that formed in the repaired area. B: myeloid cells, as indicated by CD11b signal, in control tendons, and tendons either 1 wk (1w), 2 wk (2w), or 4 wk (4w) after tenotomy and repair. Blue, nuclei (DAPI); magenta, CD11b. Scale bar for all panels equals 100 µm. C: T cells and B cells, as indicated by CD3 and B220 signal, respectively, in control tendons, and tendons either 1w, 2w, or 4w after tenotomy and repair. Blue denotes nuclei (DAPI); magenta denotes CD3; green denotes B220. Scale bar for all panels equals 50 µm. Images are reflective of n ≥ 4 samples per time point.

