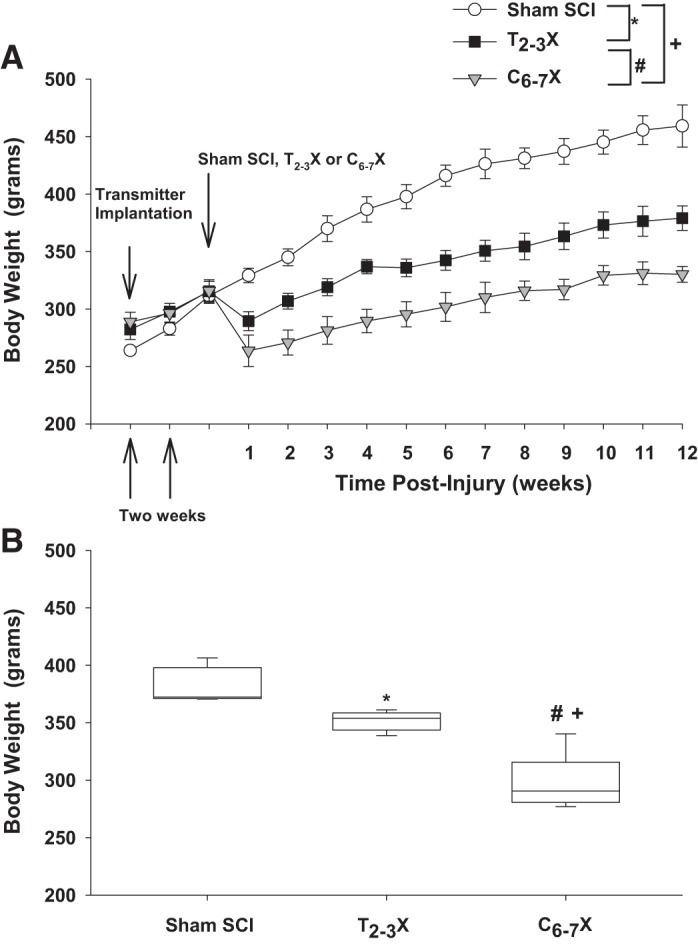
Fig. 1.

A: body weight 2 wk before the spinal cord injury (SCI) and each week for 12 consecutive weeks for spinal intact (Sham SCI), paraplegic (T2–3X), and tetraplegic (C6–7X) rats. B: box and whiskers plots for body weight averaged over the 12 wk. The central box represents the values from the 1st and 3rd quartiles (25th–75th percentiles). The vertical lines (whiskers) denote minimum and maximum values. The center line in each box plot represents the median value. *P < 0.05, Sham SCI vs. T2–3X, group effect; #P < 0.05, T2–3X vs. C6–7X, group effect; +P < 0.05, Sham SCI vs. C6–7X, group effect.
