Fig. 2.
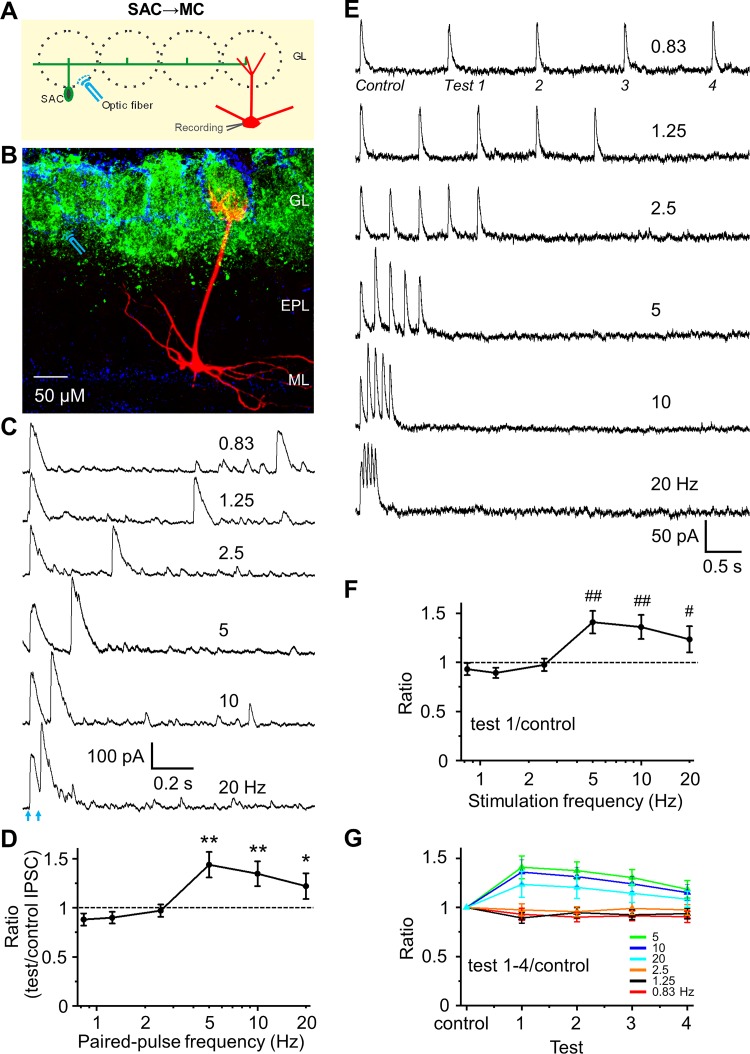
Frequency-dependent short-term facilitation of synapses from short axon cells (SACs) to mitral cells (MCs). A: schematic diagram showing the experimental design of optical stimulation of channelrhodopsin-2 (ChR2)-SACs and recording from MCs. B: labeling of ChR2 in SACs (green), DAPI (blue), and biocytin-filled MC (red). Optical stimulation of ChR2-SACs was performed at ~300 µm distance from the apical dendrite of voltage clamp-recorded MC. C: example traces of optical stimulation (arrows)-evoked inhibitory postsynaptic currents (IPSCs) from a MC held at 0 mV in response to paired-pulse optical stimulation at 6 different frequencies (0.83, 1.25, 2.5, 5, 10, and 20 Hz) in artificial cerebrospinal fluid (ACSF). D: group data showing paired-pulse ratio (PPR) of evoked IPSC peak amplitude of the test pulse to the control pulse at different frequencies in ACSF. Optical stimulation induces paired-pulse facilitation at frequency of 5, 10, and 20 Hz, with a significantly larger ratio than 1. E: example traces of a train of 5-pulse optical stimulation-evoked IPSCs from another cell. F: population data for ratio of IPSC peak amplitude of the test pulse 1 to control, evoking PPR equivalent to the paired pulse experiment in D. G: population data for ratio of IPSC peak amplitude of the test pulses 1–4 to control. A train of 5-pulse optical simulation-induced short-term synaptic facilitation of each IPSC in the sequence with a progressive decline in magnitude with continued stimulations in the train. **P < 0.01, *P < 0.05, ##P < 0.01, and #P < 0.05 vs. PPR = 1; n = 7 for D and n = 5 for F and G. EPL, external plexiform layer; GL, glomerular layer; ML, mitral cell layer.

