Fig. 4.
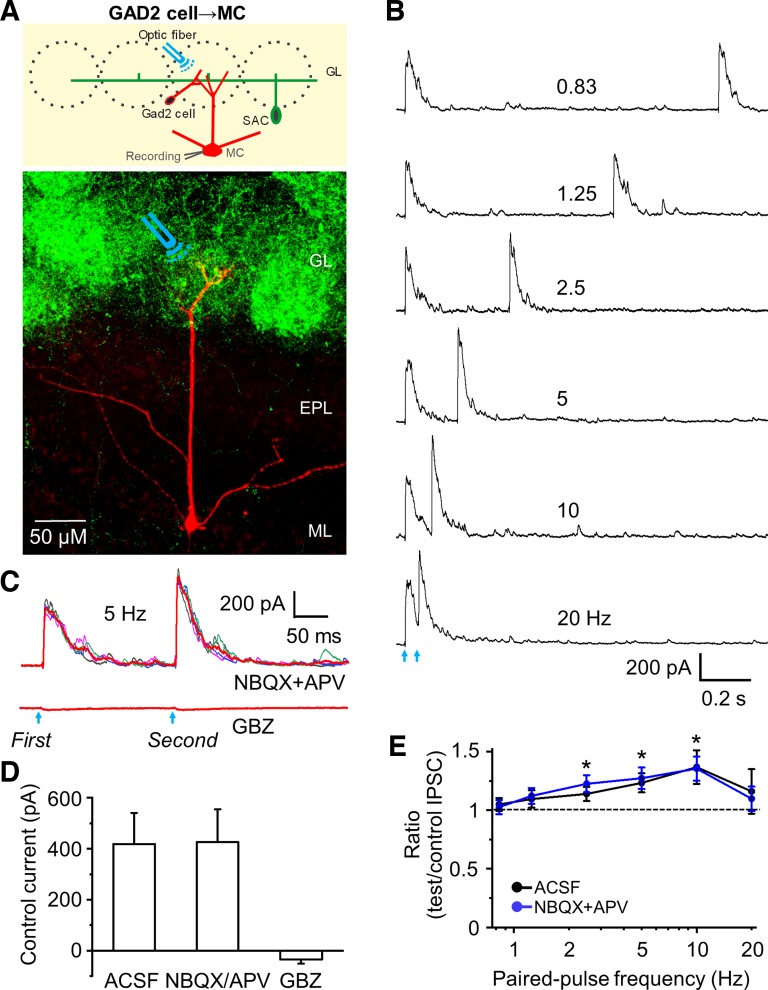
Activation of channelrhodopsin-2 (ChR2)-glutamic acid decarboxylase (GAD)2 cells evokes paired-pulse facilitation of inhibitory postsynaptic currents (IPSCs) in mitral cells (MCs). A: schematic diagram showing the experimental design of optical stimulation of ChR2-GAD2 cells and recording from MC (upper) as well as labeling of ChR2 in GAD2 cells and their dense dendrites (green) and biocytin-filled MC (red) (bottom). Optical stimulation of ChR2-GAD2 cells that synapse with apical dendritic tufts of MC was performed. B: example traces showing evoked IPSCs in artificial cerebrospinal fluid (ACSF) in MC at holding potential of 0 mV in response to paired-pulse optical stimulation at 6 different frequencies. C: example of 4 individual traces and the averaged trace (red) of synaptic currents at stimulation of 5 Hz in 1,2,3,4-Tetrahydro-6-nitro-2,3-dioxo-benzo[f]quinoxaline-7-sulfonamide (NBQX; 10 µM) + d-2-amino-5-phosphonovalerate (APV; 50 µM), and gabazine (GBZ; 10 µM). D: group data showing the peak amplitude of optical stimulation-evoked IPSCs to the control pulse in ACSF (n = 10), NBQX+APV (n = 7), and GBZ (n = 10). Combination of NBQX and APV did not change the peak amplitude of IPSC to control and test pulse. Neither individual NBQX nor APV changed the peak amplitude (both n = 3, not shown). GBZ completely blocked IPSCs. E: group data showing paired-pulse ratio of optical stimulation-evoked IPSC peak amplitude of the test pulse to the control in ACSF (n = 10) and NBQX+APV (n = 7). Paired-pulse facilitation was observed at 2.5, 5, and 10 Hz with ratios significantly larger than 1, and the ratios increased with increasing stimulation frequency from 0.83 to 10 Hz. *P < 0.01 vs. paired-pulse ratio of 1. EPL, external plexiform layer; GL, glomerular layer; ML, mitral cell layer.

