Fig. 5.
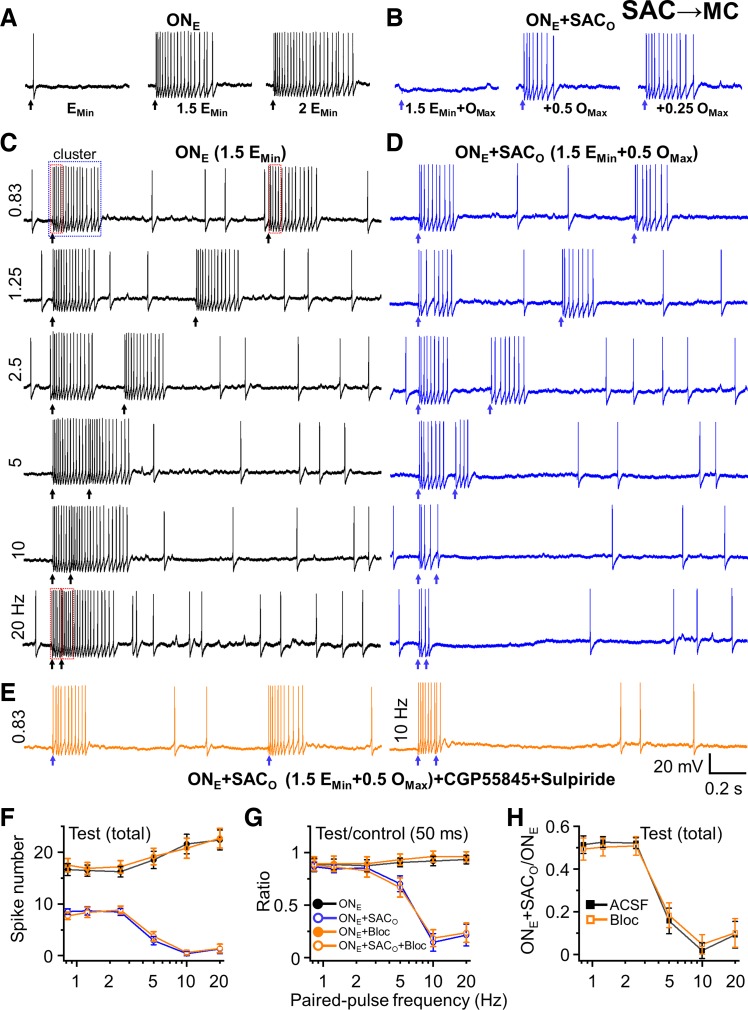
Impact of paired-pulse plasticity of short axon cell (SAC) to mitral cell (MC) synapses on MC spiking. A: spike number of firing cluster increases with increasing intensity of electric stimulation from minimum intensity (EMin; operationally defined in multiples of the minimum current required to elicit a spike in each recorded MC, 20 µA in this cell, range: 10–25 µA in all cells), 1.5 times EMin (eliciting ~50% of maximal spiking), to twofold of EMin (2 EMin, eliciting maximal MC spiking). B: optical stimulation completely or partially reverses electric stimulation (1.5 EMin)-induced firing. Maximum optical stimulation (OMax,) is operationally defined as the fraction of the optical stimulation intensity that abolished all spiking elicited by 1.5 EMin in each recorded MC (1.8 mW in this cell, range: 1.3–4.0 mW in all cells). Lower optical stimulations, 0.5 OMax (0.9 mW) and 0.25 OMax (0.45 mW), induce partial inhibition of electric stimulation-induced firing. C: paired-pulse electric stimulation (1.5 EMin) does not induce paired-pulse plasticity with a similar spike number of firing cluster to control and test pulse up to 5 Hz, with a modest enhancement of spike number to the test pulse present at 5, 10, and 20 Hz. D: paired optical stimulation (0.5 OMax) induced an inhibition of 1.5 EMin-induced firing cluster to test and control pulse at all frequencies. As frequency increases above 5 Hz, the magnitude of optical suppression of spiking in the test stimulation is enhanced, whereas there is no enhancement at frequencies of 2.5 Hz or less. E: blockade of GABAB and D2 receptor (10 µM CGP55845+100 µM sulpiride) did not change the inhibition of SACs in MC spiking. Example traces show similar spike number of firing cluster in test pulse to control at example frequency of 0.83 Hz, but much less spike number in test pulse to control at 10 Hz. F: total spike number of firing cluster to test pulse after stimulation shows that electric stimulation induces similar spike number of firing cluster at different stimulation frequencies from 0.83–20 Hz, but optical stimulation partially inhibits 1.5 EMin electric stimulation-induced firing cluster with less spike number at higher stimulation frequencies of 5, 10, and 20 Hz compared to lower stimulation frequencies (0.83, 1.25, and 2.5 Hz). G: group data showing ratios (spike number of firing cluster to test pulse/control pulse) much less than 1 (‘paired-pulse depression’) at 5, 10, and 20 Hz with both electric and optical stimulation (ONE+SACO) but not electric stimulation alone (ONE). Blockade of GABAB and D2 receptor (Bloc, 10 µM CGP55845+100 µM sulpiride) did not change the ratios. To obtain ratios, the stimulation-induced 250–300 ms firing cluster (blue dot box in C) and the spike numbers in a 50-ms poststimulation time window (red dot boxes in C) were assessed. This window was chosen at 20 Hz because there is only a 50-ms interstimulus interval in total. To validate this approach, we compared the first 50-ms window against a total spiking epoch for the low frequencies of 0.83, 1.25, and 2.5 Hz, which have sufficient interstimulus interval to do so. The ratio of spike number from either whole firing cluster or only partial 50-ms window immediately after stimulations was similar. This indicated that the analysis of a 50-ms window provides a reasonable comparison for the spiking ratio of the paired-pulse events across the entire frequency range. Legends in G apply to F. H: ratio of total spike number of firing cluster to the test/second pulse with both electric stimulation and optical stimulation to electric stimulation alone (ONE+SACO/ONE) also shows that optical stimulation at higher frequencies (5, 10, and 20 Hz) induces a firing cluster with much less spike number than at low frequencies (0.83, 1.25, and 2.5 Hz) that was not changed by blockade of GABAB and D2 receptor (‘Bloc’). n = 7 for artificial cerebrospinal fluid (ACSF) and n = 6 for Bloc in F, G, and H.

