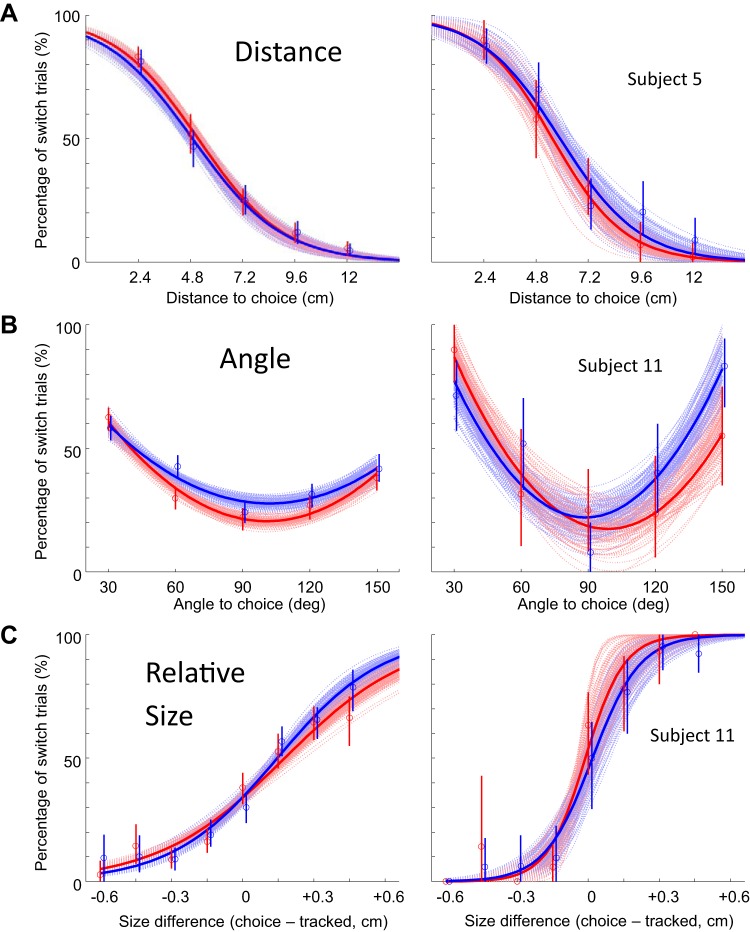
Fig. 4.
Percentage of switch choices, as a function of different task variables in each block of the continuous tracking task. A–C show data for all subjects (left) and for an example subject (right). A: switch choice percentage as a function of target distance (left: 5 subjects, n = 2,319 trials; right: 1 subject, n = 557 trials). B: switch choice percentage as a function of target angle with respect to current tracking direction (left: 11 subjects, n = 3,676 trials; right: 1 subject, n = 237 trials). C: switch choice percentage as a function of the radius of the choice target relative to the tracked target (choice minus tracked, in cm) (left: 11 subjects, n = 2,973 trials; right: 1 subject, n = 320 trials). Red, hard trials; blue, easy trials. Each panel shows a fit to the data (thick line) as well as 100 fits obtained after the data were resampled with replacement (thin curves). Vertical lines indicate confidence intervals calculated by resampling.

