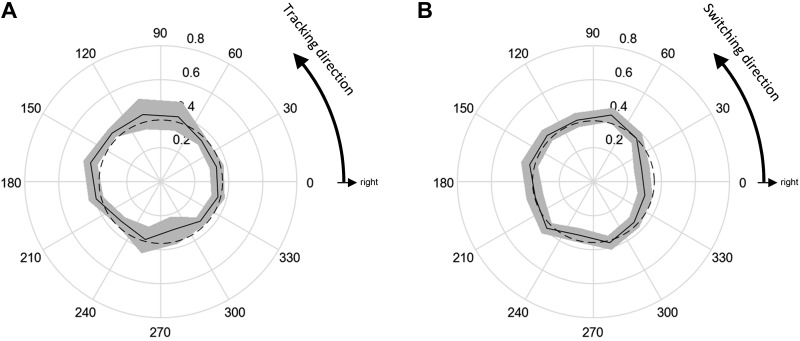
Fig. 5.
Percentage of switch choices made to the choice target during the continuous tracking task (solid lines) compared with a uniform circle (dashed lines). Shaded areas indicate the 95% confidence interval computed using the Clopper-Pearson method. A: the percentage is plotted as a function of the ongoing tracking direction (in absolute angles with respect to the workspace) at the time the choice target appeared. B: the percentage is plotted as a function of the direction to the choice target. In both A and B, only trials where the choice target was oriented at 90° to the current tracking direction are included (n = 5,971 trials).

