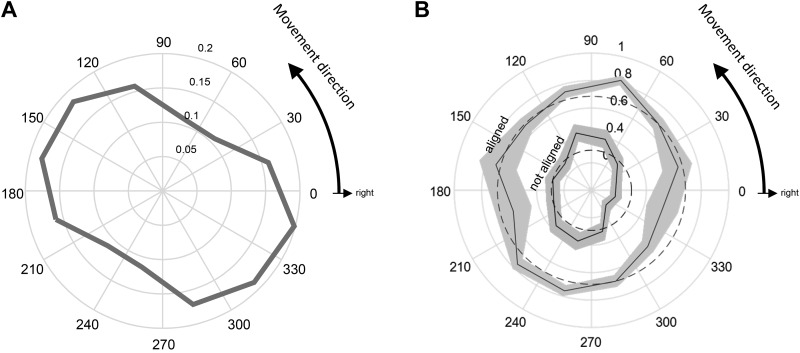
Fig. 6.
Data from the discontinuous tracking task. A: calculated cost (in N·m) of moving to a target as a function of the direction to that target (n = 3,019 trials). Note that, similarly to Fig. 3A, the plot implies that there is a greater cost in moving to a target oriented at 150° or 330°. B: outer lines indicate the probability of selecting a target that is aligned to the previous movement, as a function of the direction to that target (n = 2,159 trials). Inner lines show the probability of selecting a target that is not aligned with the previous movement, as a function of the direction to that target (n = 860 trials). Solid lines indicate means, shaded areas indicate confidence intervals (computed using the Clopper-Pearson method), and dashed circles indicate a uniform distribution.

