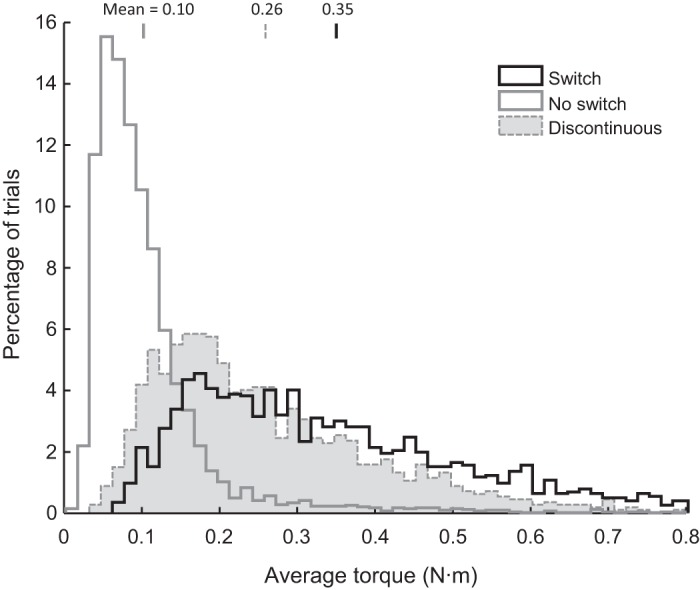
Fig. 8.

Distributions of biomechanical costs for different kinds of movements (in N·m), computed as the sum of the absolute shoulder and elbow muscle torques averaged across time (see materials and methods). Black histogram shows continuous tracking trials when the subject switched to the choice target (n = 2,144 trials). Gray histogram shows continuous tracking trials when the choice target was ignored (n = 3,827 trials). Dashed histogram represents the discontinuous tracking task (n = 6,108), with data resampled 100 times from each 30° bin of directions, to avoid biases caused by the anisotropy of subject choices. Small vertical lines above the plot indicate the means of each distribution.
