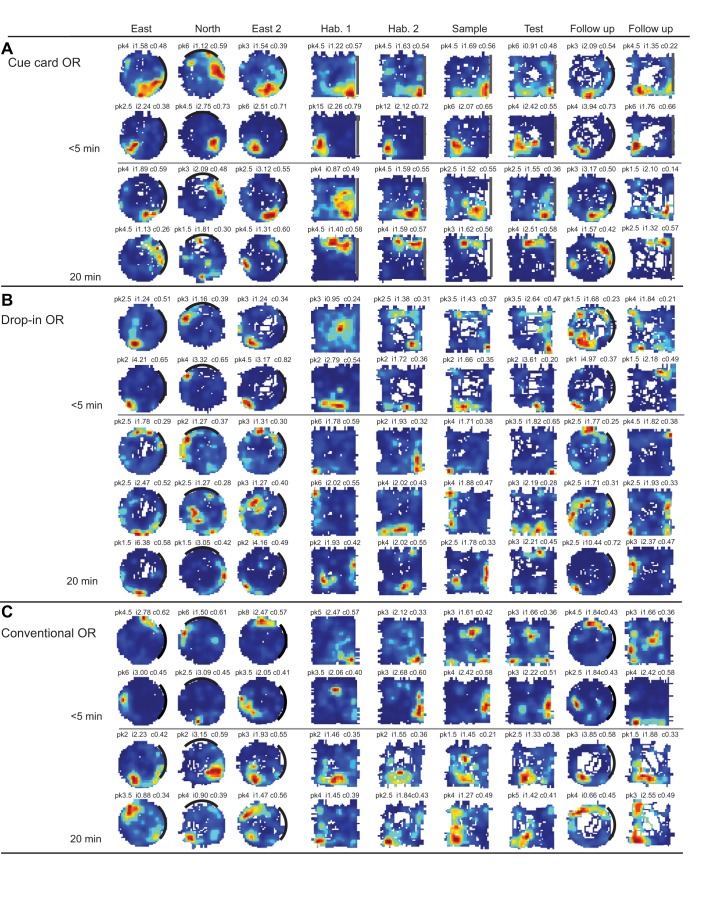
Fig. 4.
Representative place × firing rate maps of individual CA1 place cells recorded during each of the three object recognition (OR) protocols. For each map, firing rate is represented by the color-coded pixels, with red referring to the location(s) where the cell discharged at its highest rate, and blue referring to the visited locations where the cell was silent. White pixels represent areas of the arena that were unvisited by the given mouse. Each row represents the location-specific firing properties of a given CA1 neuron recorded across the nine 10-min sessions of a respective protocol. The label above the top row of maps identifies the respective recording sessions. The numbers on the left and above each place × firing rate map represent the average in-field firing rate for that cell (pk), information content (i), and spatial coherence (c). A: representative place × firing rate maps from two mice tested in the Cue Card OR protocol with an intersession delay of 5-min and 20-min, respectively. B: same as in A, but for two mice tested in the Drop-In OR protocol. C: same as in A, but for two mice tested in the Conventional OR protocol. Representative place × firing maps for “object cells” can be found in Supplemental Fig. S1 at https://doi.org/10.6084/m9.figshare.11482281.

