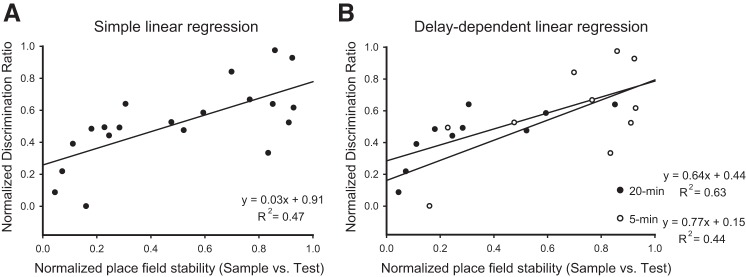
Fig. 6.
A: linear regression analysis illustrates the positive relationship between the normalized discrimination ratio and the normalized place field stability averaged for each mouse across object recognition protocols. B: regression analysis and representative plot demonstrate the positive relationship between the normalized discrimination ratio and the normalized place field stability averaged over each mouse by delay.

