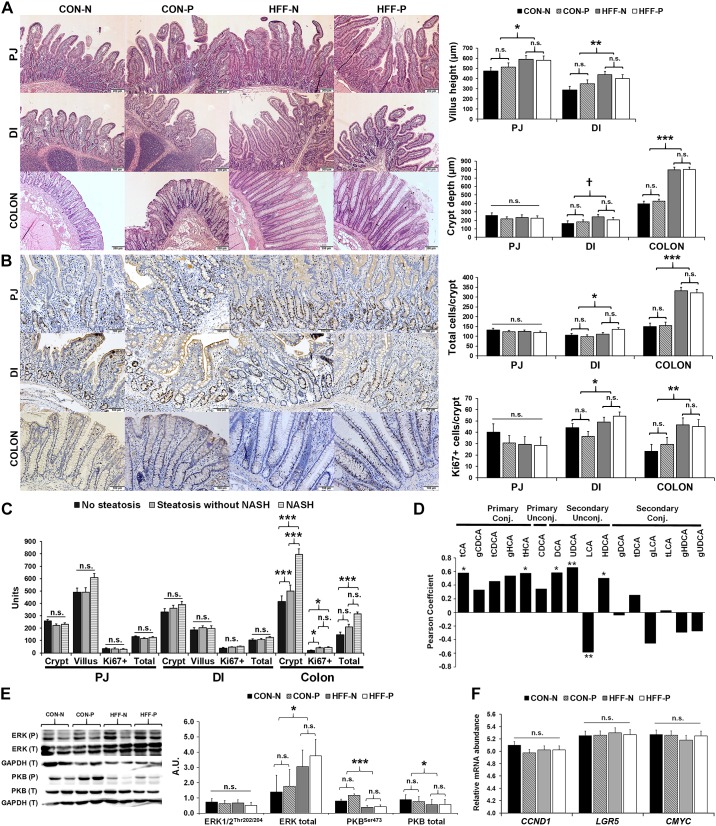
Fig. 9.
Cellular proliferation and hyperplasia increased in the intestinal mucosa of nonalcoholic steatohepatitis (NASH) pigs. A: photographs of hematoxylin-eosin staining of paraffin embedded sections showing an increase in villus height in proximal jejunum (PJ) and distal ileum (DI), and an increase in crypt depth in colon of high-fructose, high-fat (HFF)-fed pigs. B: active cell division, represented by an increase of crypt cell nuclei with clear brown staining (Ki67+ cells), was higher in DI and colon crypts of HFF-fed pigs. C: crypt depth (µm), number of Ki67+ cells, and total number of cells per crypt increased in NASH pigs compared with pigs without steatosis. D: primary conjugated and secondary unconjugated bile acids (BAs) were correlated (Pearson) with Ki67+ cells in colon crypts. E: representative Western blots (left) and histograms with the quantification of bands expressed as arbitrary units (A.U.; right), to measure the expression of proteins involved in BA-induced cell proliferation. Total extracellular signal-regulated kinase 1/2 (ERK1/2) increased, while phosphorylated (P) and total (T) protein kinase B (PKB) decreased in HFF group. F: gene expression of cyclin D1 (CCND1), leucine rich repeat containing G protein-coupled receptor 5 (LGR5), and master regulator of cell cycle entry (CMYC) did not differ between groups. Relative mRNA abundance was measured by qPCR, and reported as ΔCt values. All values are least square means ± SE. P values were adjusted for multiple testing with Tukey’s post hoc test. †P ≤ 0.1, *P ≤ 0.05, **P ≤ 0.01, ***P ≤ 0.001. n.s., Nonsignificant. CA, cholic acid; CDCA, chenodeoxycholic acid; DCA, deoxycholic acid; g, glycine; HCA hyocholic acid; HDCA, hyodeoxycholic acid; LCA, lithocholic acid; t, taurine; UDCA, ursodeoxycholic acid.

