Fig. 2.
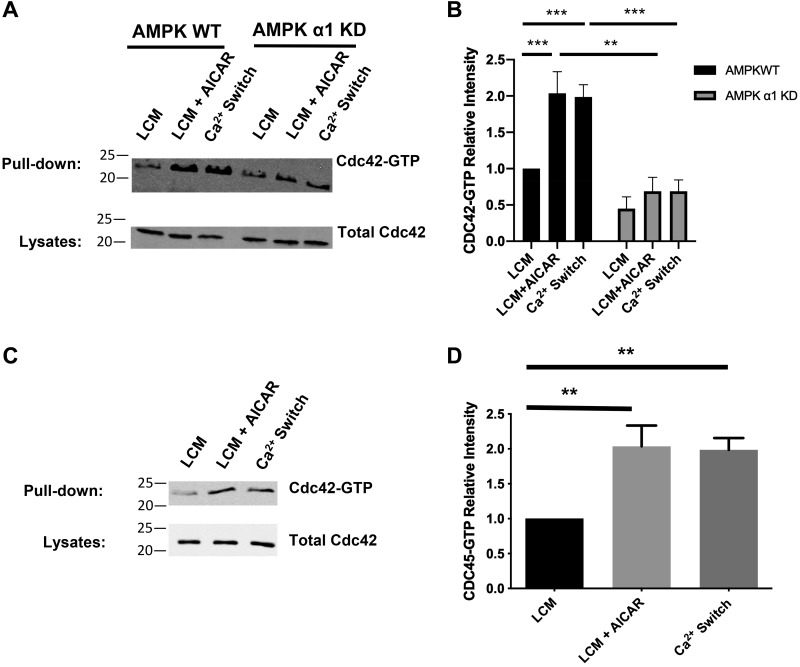
AMP-activated protein kinase (AMPK) regulates the level of GTP-bound Cdc42. A: confluent Madin-Darby canine kidney (MDCK) cells were stably transfected with pSUPER containing shRNA against the AMPKα1 isoform [AMPKα1 knockdown (KD)] or the empty vector [AMPK wild-type (WT)] and incubated in media containing 5 μM Ca2+ [low-Ca2+ media (LCM)] for 16 h. Fresh LCM with or without 2 mM AICAR or media containing 1.8 mM Ca2+ (Ca2+ switch) were introduced for 2 h. Cell lysates from each condition were obtained and analyzed for GTP-bound Cdc42 via a pulldown assay as described in experimental procedures. Equal amounts of precipitates were then separated on SDS-PAGE and probed with anti-Cdc42 antibody. Cells lysates were analyzed by Western blotting with the Cdc42 antibody. B: quantification of the immunoreactive signal for Cdc42 in precipitates normalized to the level of Cdc42. Data were analyzed for each experimental condition based on three independent experiments and represent mean intensity relative to LCM (WT) level ± SE. ** or ***Significant difference due to the presence of AICAR (P < 0.01) or the Ca2+ switch (P < 0.001) compared with LCM conditions based on the two-way ANOVA and Sidak’s multiple comparison test. C: confluent MDCK cells were incubated in media containing 5 μM Ca2+ [low-Ca2+ media (LCM)] for 16 h. Fresh LCM with or without 2 mM AICAR or media containing 1.8 mM Ca2+ (Ca2+ switch) were introduced for 2 h. Cell lysates from each condition were obtained and analyzed for GTP-bound Cdc42 via a pulldown assay, as described in experimental procedures. Equal amounts of precipitates were then separated on SDS-PAGE and probed with anti-Cdc42 antibody. Cell lysates were analyzed by Western blotting with the Cdc42 antibody. D: quantification of the immunoreactive signal for Cdc42 in precipitates normalized to the level of Cdc42. Data were analyzed for each experimental condition based on three independent experiments and represent mean intensity relative to LCM (WT) level ± SE. **Significant difference due to the presence of AICAR (P < 0.01) or the Ca2+ switch (P < 0.01) compared with LCM conditions based on the one-way ANOVA and with Dunnett’s multiple-comparisons test.

