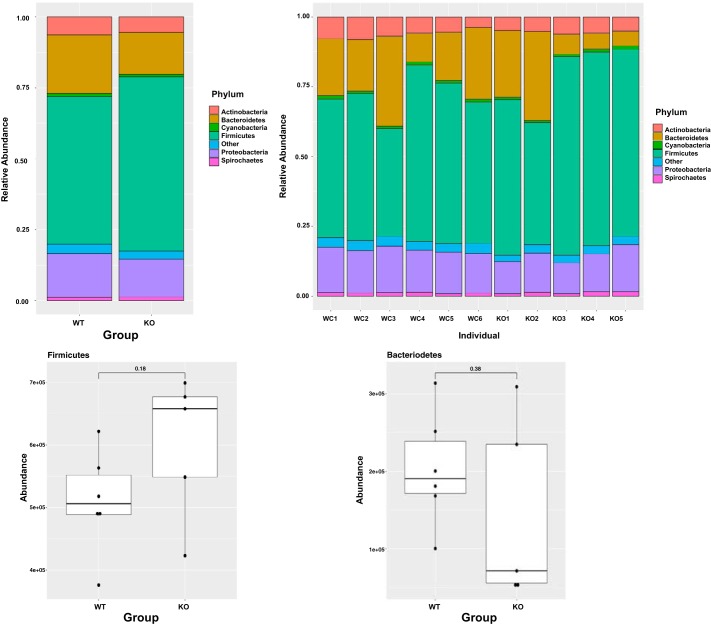
Fig. 6.
Top: bar plots representing changes in the microbial abundance at phyla level in cecal contents of wild-type (WT) and olfactory receptor-78 (Olfr-78) knockout (KO) mice. Bottom: box plots showing the differences in the abundance of Firmicutes and Bacteriodetes between WT and Olfr-78 KO mice. Differential testing was conducted by two-sample t test. P < 0.05 was considered significant.

