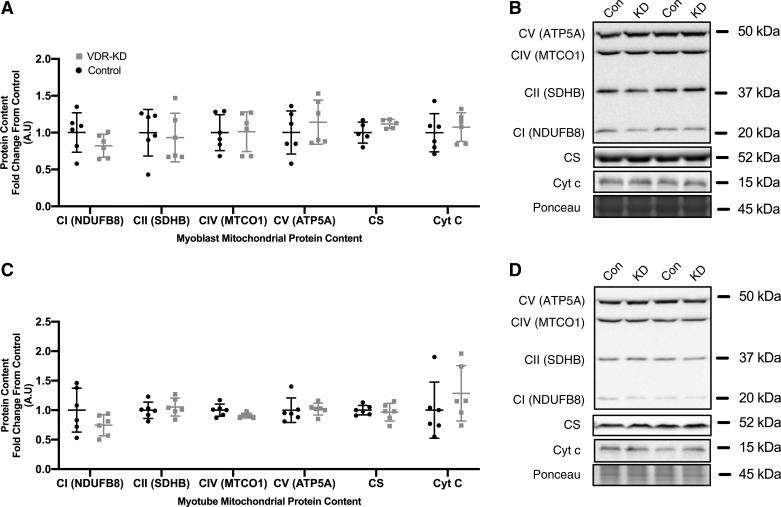
Fig. 3.
No change in markers of mitochondrial protein content in vitamin D receptor-knockdown (VDR-KD) myoblasts and myotubes compared with control. A–D: protein abundance of mitochondrial subunits complex I (CI; NDUFB8), complex II (CII; SDHB), complex IV (CIV; MTCO1), complex V (CV; ATP5A), as well as citrate synthase (CS) and cytochrome c (Cyt c) in control and VDR-KD myoblasts (A and B) and myotubes (C and D). Data are expressed as means ± SD (n = 6 lanes/group) and represented as a fold change from control.

