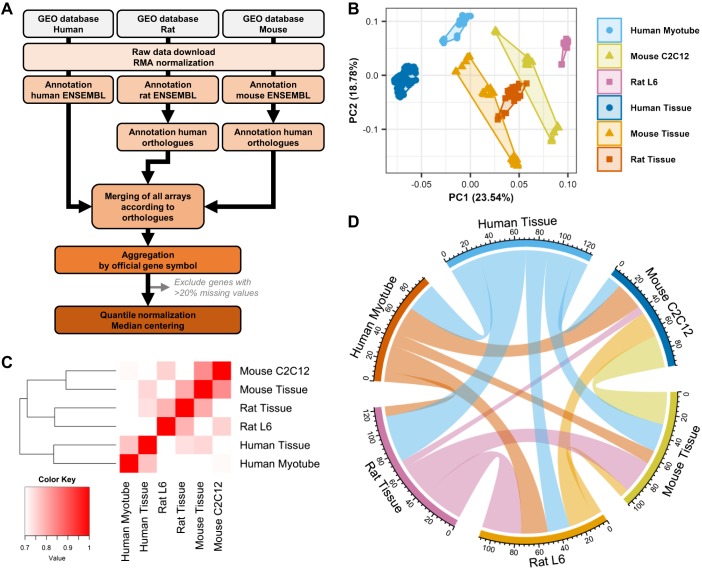
Fig. 1.
Transcriptomic profiling of rat L6, mouse C2C12, and human primary myotubes. Publicly available data sets for mouse, rat, and human skeletal muscle tissue and cell models were downloaded from the Gene Expression Omnibus (GEO) repository. A: raw data were processed, normalized, and annotated according to the official human gene ortholog nomenclature. B: principal component (PC) analysis demonstrated a clear segregation of all samples from each other. C: correlation matrix comparing all transcripts from one model to the other five. D: chord diagram presenting the overlap of the top 100 expressed genes in each model. The thickness of a band is proportional to the number of common genes between 2 models. RMA, robust multi-array.

