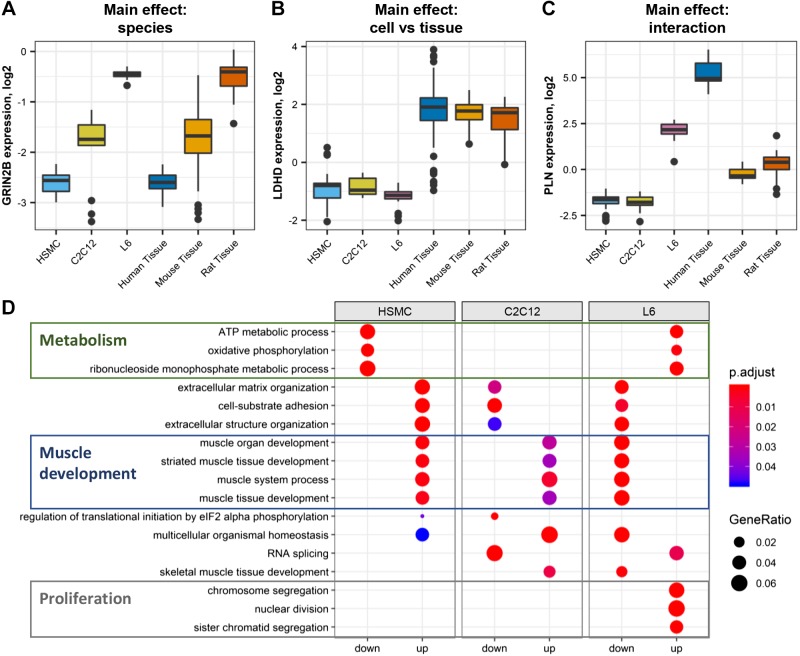
Fig. 2.
Gene enrichment in L6, C2C12, and human primary myotubes. A: example of a gene (GRIN2B) exhibiting species differences. B: example of a gene (LDHD) differentially expressed in cells compared with skeletal muscle tissue. C: example of a gene (PLN) which expression is affected by both species and cell/tissue sample. D: gene ontology enrichment of genes differentially expressed in one model compared with the other two (false discovery rate < 0.05). Gene ratio is the number of significantly different genes divided by the total number of genes associated with a specific pathway. eIF2, eukaryotic translation initiation factor 2; HSMC, human skeletal muscle cells; p.adjust, adjusted P value.

