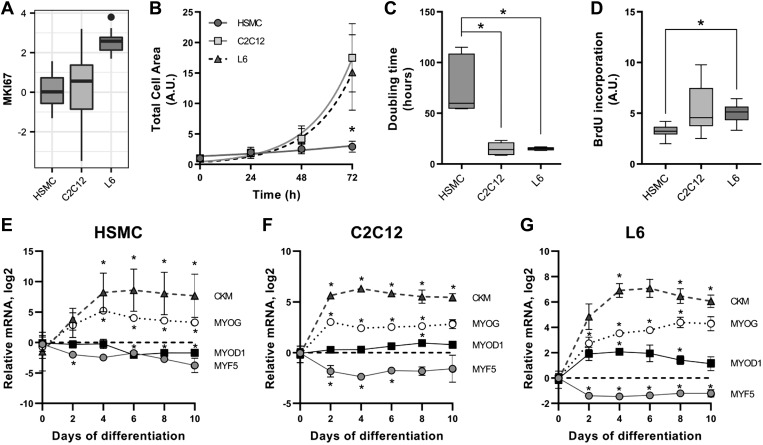
Fig. 3.
Proliferation rates of L6, C2C12, and human primary myotubes. A: mRNA expression of the proliferation marker MKI67. B: total area covered by cells during 3 days of proliferation. Quantification of images was done with ImageJ, as described in methods. Mean ± SE, Exponential (Malthusian) growth fit; n totals are as follows: HSMC: n = 7 replicates from 7 independent donors, C2C12: n = 5 independent experiments, L6: n = 5 independent experiments, *P < 0.05 in human skeletal muscle cells (HSMC) compared with L6 and C2C12. C: doubling time calculated from the proliferation curves. Box-and-whisker Tukey plot; n totals are as follows: HSMC: n = 7 replicates from 7 independent donors, C2C12: n = 5 independent experiments, L6: n = 5 independent experiments, Kruskal-Wallis test with Dunn’s multiple comparison, *P < 0.05. D: BrdU incorporation into DNA measured as described in methods. Box-and-whisker Tukey plot; n totals are as follows: HSMC: n = 6 replicates from 3 independent donors, C2C12: n = 6 independent experiments, L6: n = 6 independent experiments, one-way ANOVA with Tukey’s multiple comparison, *P < 0.05. E–G: differentiation time course of mRNA expression of skeletal muscle markers creatine kinase (CKM), myogenin (MYOG), myogenic differentiation 1 (MYOD1), and myogenic factor 5 (MYF5). Mean ± SE, Dot plot; n totals are as follows: HSMC: n = 5 replicates from 5 independent donors, C2C12: n = 4 independent experiments, L6: n = 4 independent experiments, paired one-way ANOVA with Dunnett’s multiple testing, *P < 0.05 compared with undifferentiated cells. A.U., arbitrary units.

