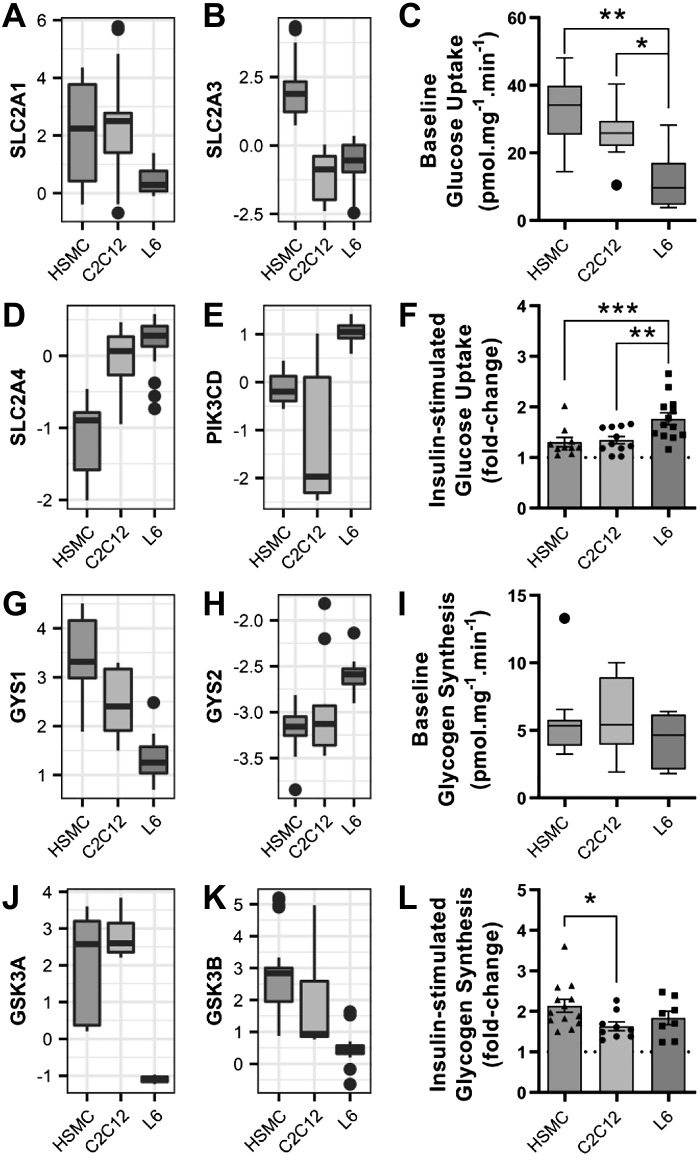
Fig. 4.
Insulin-induced glucose uptake and glycogen synthesis in L6, C2C12, and human primary myotubes. A and B: mRNA expression of glucose transporter 1 and 3 (SLC2A1 and SLC2A3). C: basal glucose uptake, as measured using 2-[1,2-3H]deoxy-d-glucose. Box-and-whisker Tukey plot; n totals are as follows: HSMC: n = 11 replicates from 11 independent donors, C2C12: n = 11 independent experiments, L6: n = 13 independent experiments, one-way ANOVA with Tukey’s multiple comparison. D and E: mRNA expression of glucose transporter 4 (SLC2A4) and the delta subunit of phosphatidylinositol 3-kinase (PIK3CD). F: insulin-stimulated glucose uptake, as measured using 2-[1,2-3H]deoxy-d-glucose. Means ± SE and individual data points: n totals are as follows: HSMC: n = 11 replicates from 11 independent donors, C2C12: n = 11 independent experiments, L6: n = 13 independent experiments, one-way ANOVA with Tukey’s multiple comparison. G and H: glycogen synthase (GS) mRNA expression [GS 1 isoform (GYS1) and GS 2 isoform (GYS2)]. I: basal glycogen synthesis, as measured by the incorporation of [14C]glucose into glycogen. Box-and-whisker Tukey plot; n totals are as follows: HSMC: n = 12 replicates from 12 independent donors, C2C12: n = 9 independent experiments, L6: n = 8 independent experiments, Kruskal-Wallis test with Dunn’s multiple comparison. J and K: glycogen synthase kinase 3 (GSK3) mRNA expression. L: insulin-stimulated glycogen synthesis as measured by the incorporation of [14C]glucose into glycogen. Means ± SE and individual data points; n totals are as follows: HSMC: n = 12 replicates from 12 independent donors, C2C12: n = 9 independent experiments, L6: n = 8 independent experiments, one-way ANOVA with Tukey’s multiple comparison, *P < 0.05, **P < 0.01, ***P < 0.001. HSMC, human skeletal muscle cells.

