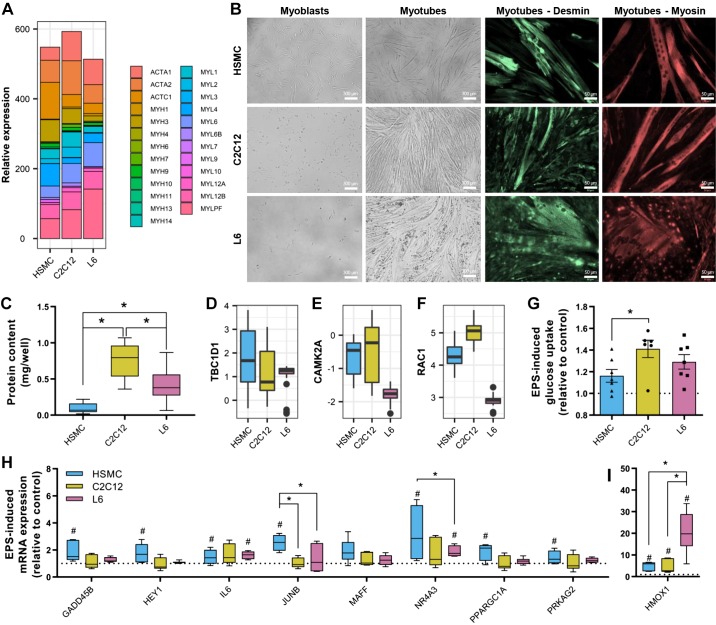
Fig. 6.
Response to electrical pulse stimulation (EPS) in L6, C2C12, and human primary myotubes. A: mRNA levels of myosin and actin isoforms. B: representative images of myotubes during proliferation and after complete differentiation. Staining for desmin and myosin was performed using specific antibodies as described in methods. Representative images are shown for each staining. C: protein content per well measured by bicinchoninic acid assay. Box-and-whisker Tukey plot; n totals are as follows: HSMC: n = 11 replicates from 11 independent donors, C2C12: n = 7 independent experiments, L6: n = 6 independent experiments, Kruskal-Wallis test with Dunn’s multiple comparison. D–F: mRNA levels of the GTPase-activating protein for Rab family protein TBC1D1, Ca2+/calmodulin-dependent protein kinase II (CAMK2A), and RAC1. G: electrical pulse stimulation-induced glucose uptake measured using 2-[1,2-3H]deoxy-d-glucose. Mean ± SE and individual data points: n totals are as follows: HSMC: n = 7 replicates from 7 independent donors, C2C12: n = 6 independent experiments, L6: n = 7 independent experiments, one-way ANOVA with Tukey’s multiple comparison. H and I: mRNA expression of exercise-responsive genes measured by quantitative PCR. Box-and-whisker Tukey plot; n totals are as follows: HSMC: n = 5 replicates from 5 independent donors, C2C12: n = 6 independent experiments, L6: n = 6 independent experiments, two-way ANOVA with Fisher’s least-significant difference comparison. #P < 0.05, significant response to EPS. *P < 0.05. HSMC, human skeletal muscle cells.

