FIGURE 4.

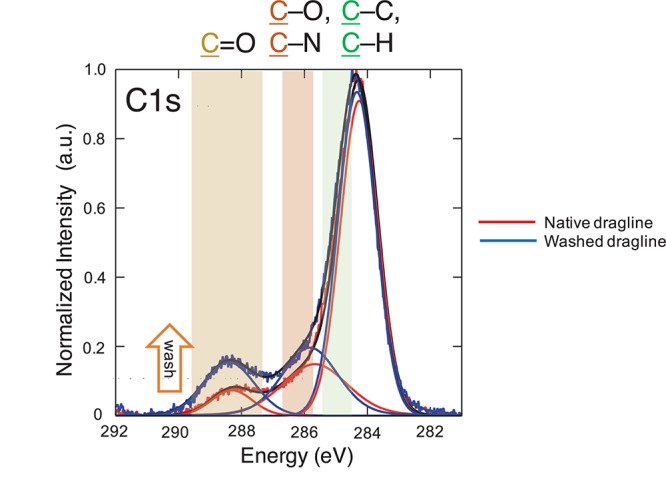
XPS spectra of the native spider dragline (red) and spider dragline after washing with ether (blue). The peak fitting results are also shown in the same color. The details on the peak fitting is described in Experimental section.

XPS spectra of the native spider dragline (red) and spider dragline after washing with ether (blue). The peak fitting results are also shown in the same color. The details on the peak fitting is described in Experimental section.