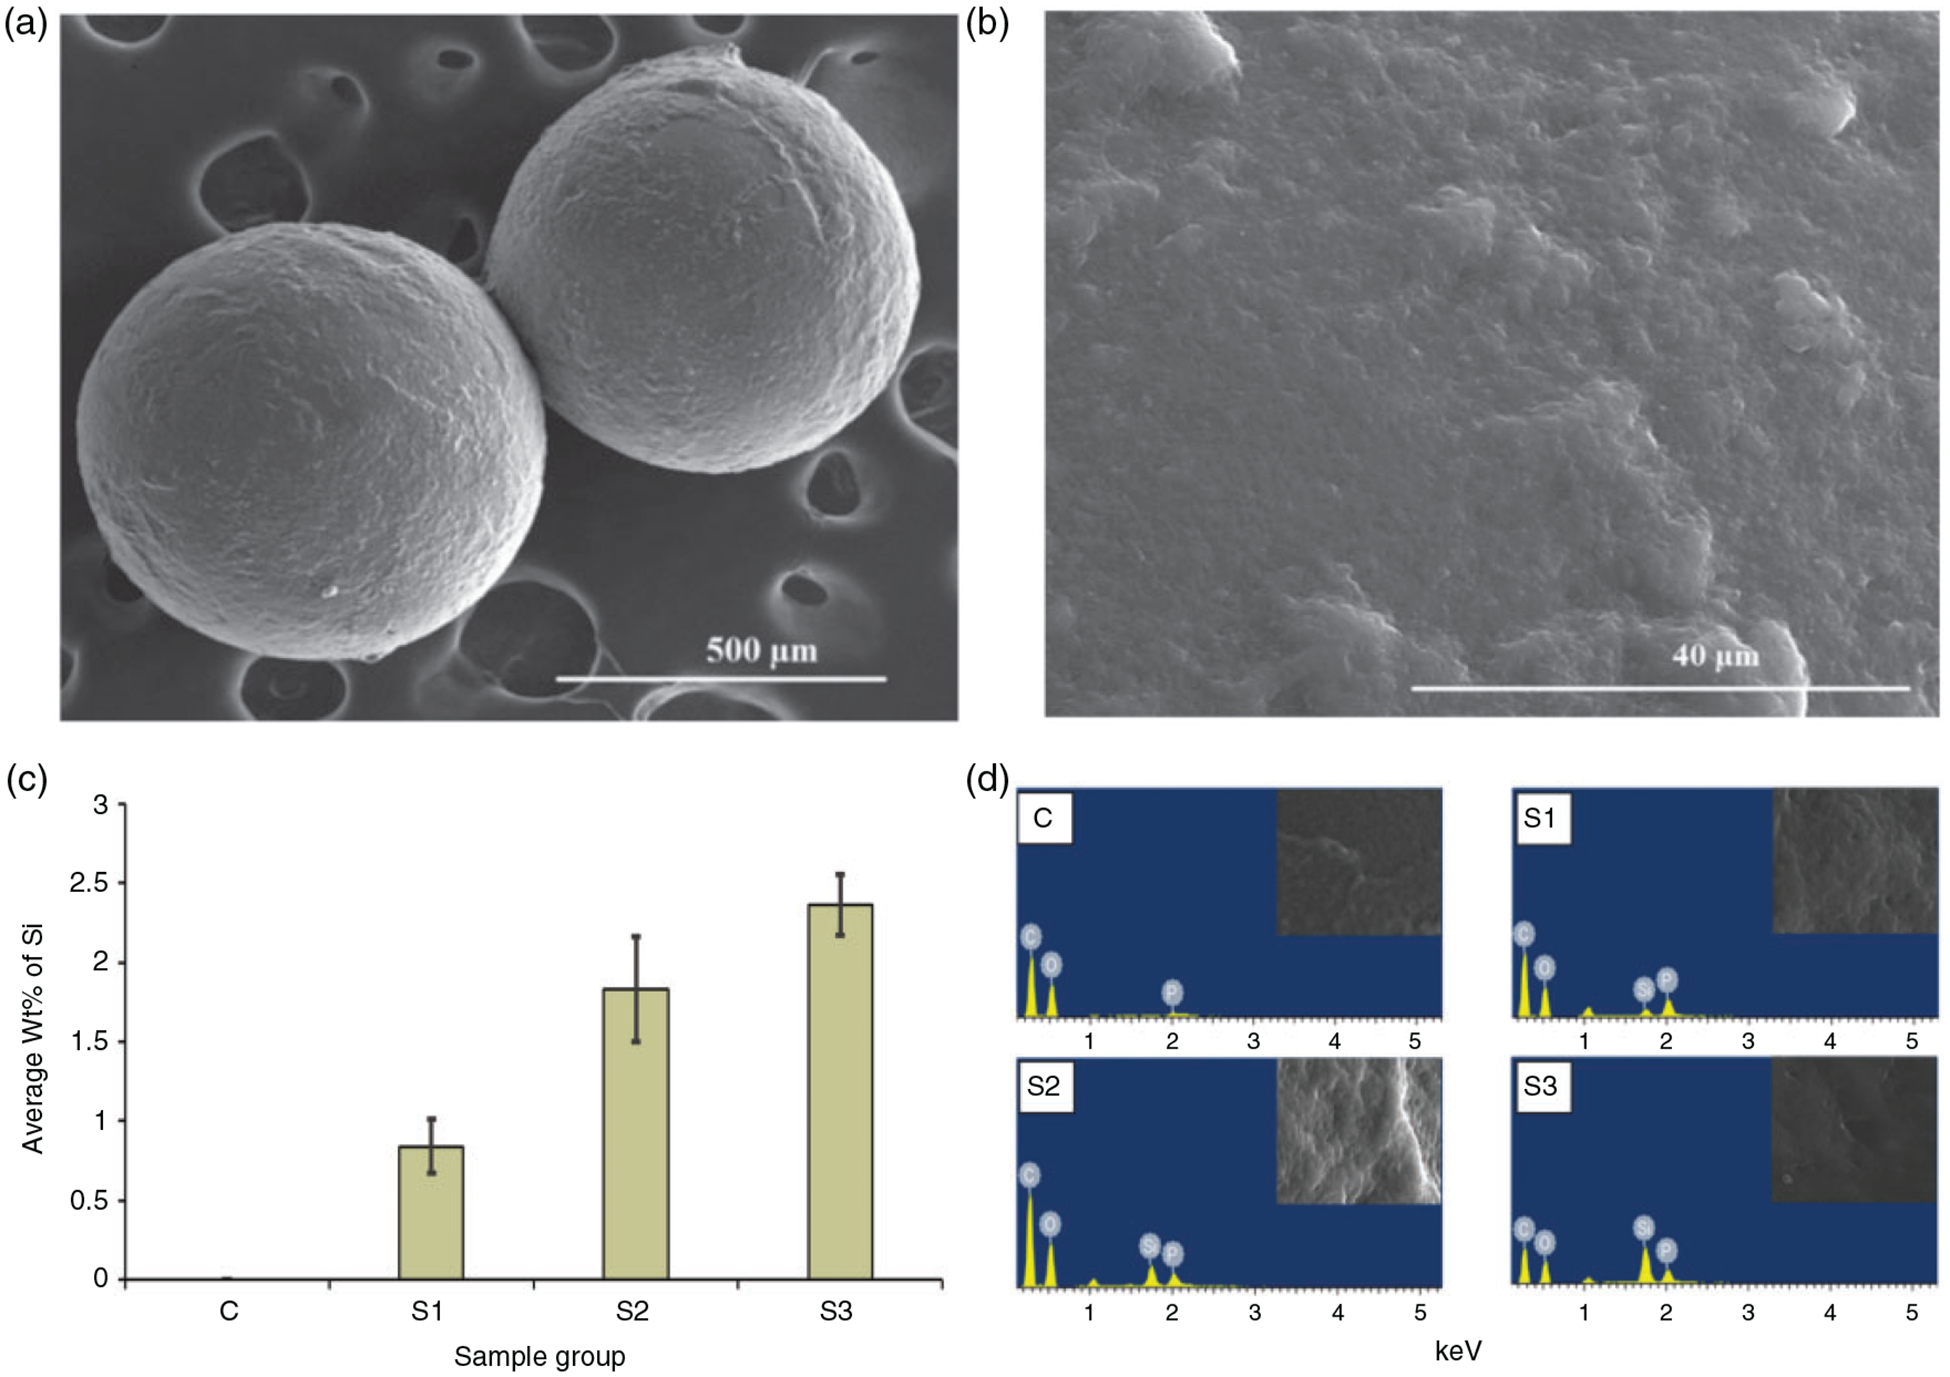
Figure 1.

Representative SEM images for microparticle showing the spherical morphology at low magnification (a) (100×) and the surface at high magnification (b) (2000×). The bar graph on c shows the quantitative analysis of elemental Si along the surface of microparticles. Highest wt. % Si was observed in the S3 groups containing 10% (w/w) nSiO2. EDS spectrum (d) shows the elements present at the surface of the microparticles.
