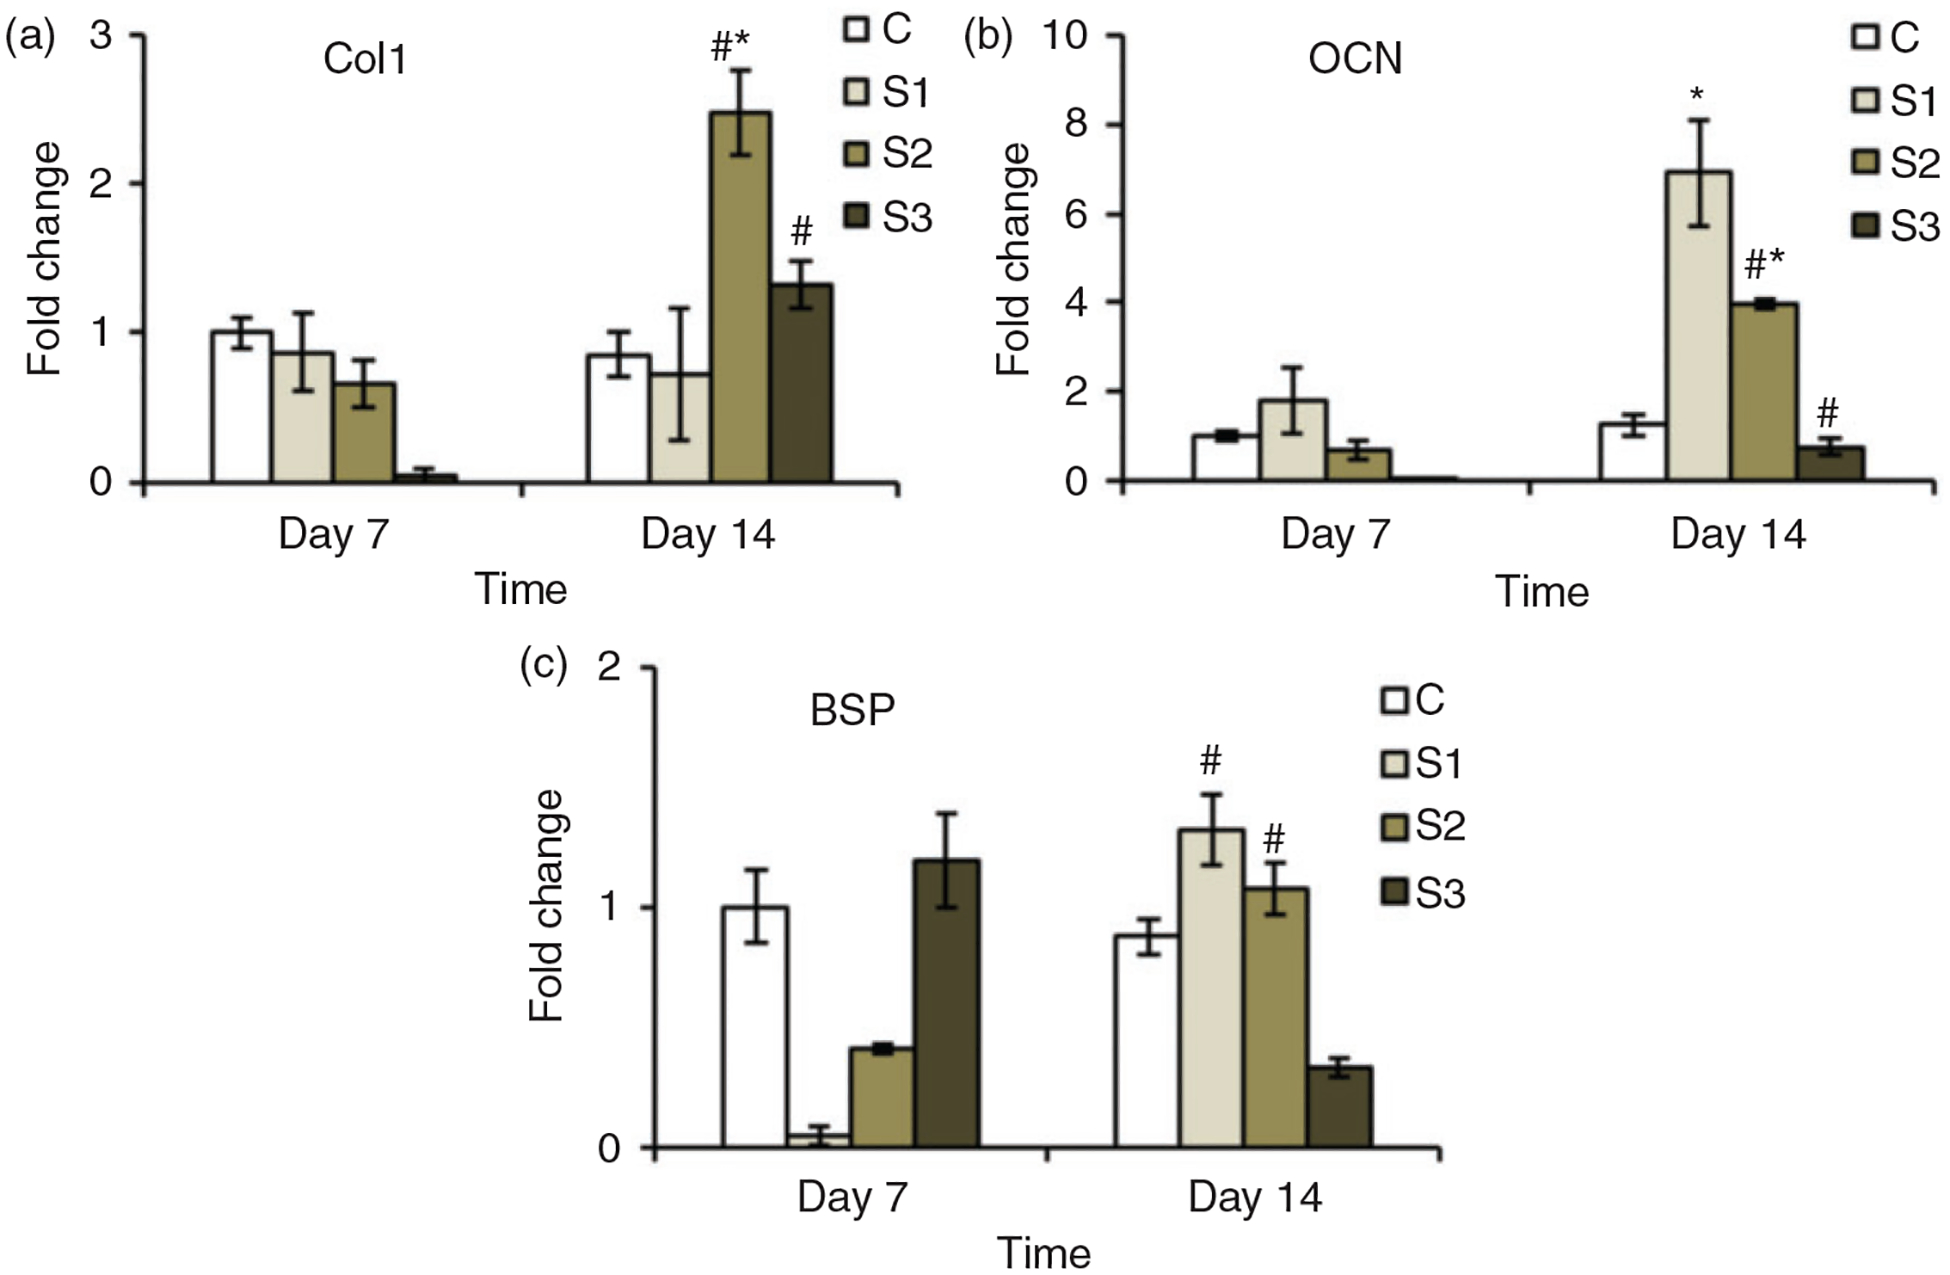
Figure 9.

Expression profile for osteoblast specific genes over 14 days. The expression of different genes by the cells growing on the sample groups (S1, S2 and S3) was higher than that expressed by the cells growing on the control group (C). * represents the significant difference from the control group on same day and # represents significant difference for same group on different days.
