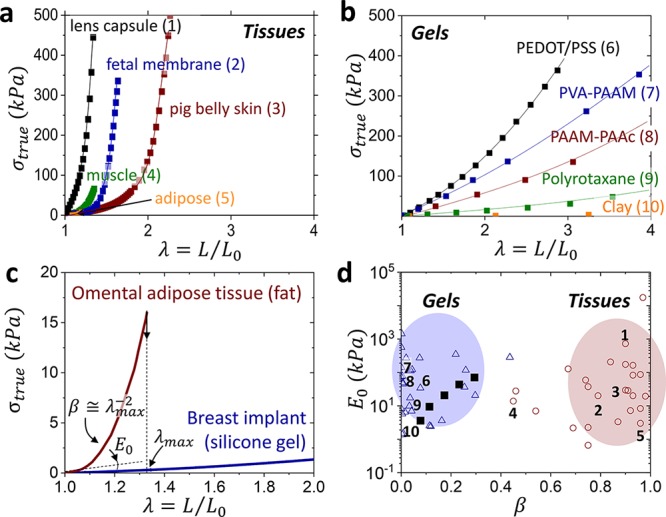
Figure 1.

Mechanical mismatch. Stress–elongation curves of assorted (a) biological tissues and (b) polymeric gels, which demonstrate tissue’s much stronger stiffening (Tables S1 and S2). Lines guide the reader, while data points represent literature data. (c) Stress–elongation responses of omental adipose tissue and silicone gel extracted from a commercial breast implant display a significant difference in strain-stiffening (β) despite a similarity in the Young’s modulus (E0). (d) An E0 vs β map partitions polymeric gels (△) and biological tissues (○) as two distinct classes of materials. The β values are obtained by fitting stress–elongation curves with eq 1, whereas E0 corresponds to the curve slope at λ → 1 (eq 2). The model is successful in fitting the entirety of gel elasticity, but only the elastic portion of tissue response before yielding.17 Numbers at data points correspond to the stress–elongation curves in (a, b). Bottlebrush elastomers (■) mimic the stress–strain response of gels,18 but are unable to reach the tissue territory.
