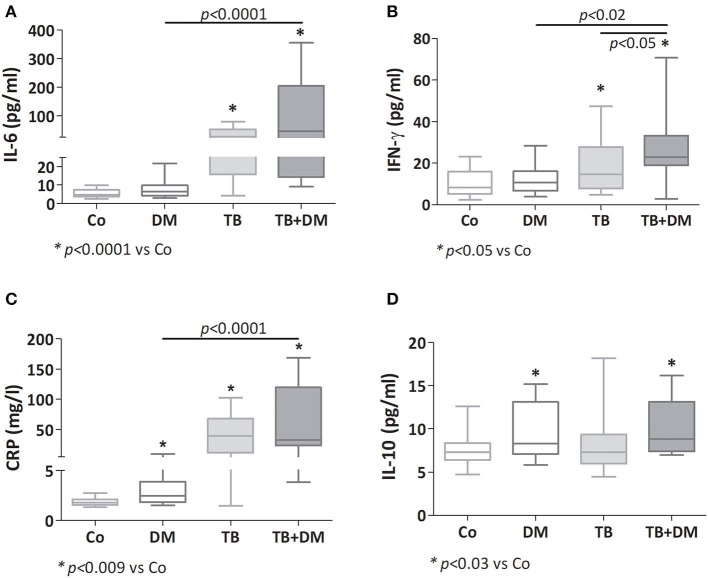
Figure 1.
Plasma levels of IL-6 (A), IFN-γ (B), C reactive protein (CRP; C) and IL-10 (D) in controls (Co), patients with type 2 diabetes (DM), with pulmonary tuberculosis (TB) or with TB and DM (TB-DM). Box plots show median values, 25–75 percentiles from data in each group with maximum and minimum values.

