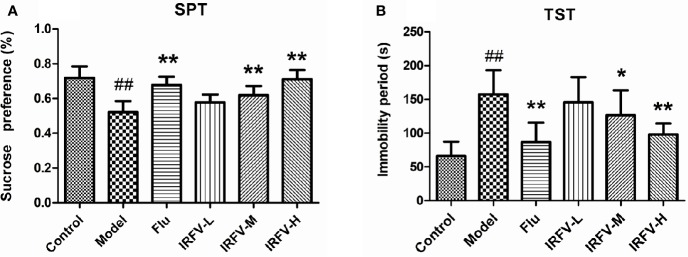
Figure 2.
The immobility time of the TST in all groups (A). In the model group, the immobility times were dramatically longer than those in the control group (p < 0.01). However, after administration of Flu and IRFV, the immobility time was shortened significantly (p < 0.05 or p < 0.01), but no obvious difference was observed in the IRFV-L group (p > 0.05). SPT results (B). The sucrose preference of the model group decreased (p < 0.01), while both Flu and IRFV treatments increased the sucrose preference (p < 0.05 or p < 0.01). However, the sucrose preference of IRFV-L also showed no obvious difference (p > 0.05). ##p < 0.01 vs the control group; *p < 0.05, **p < 0.01 vs the model group.

