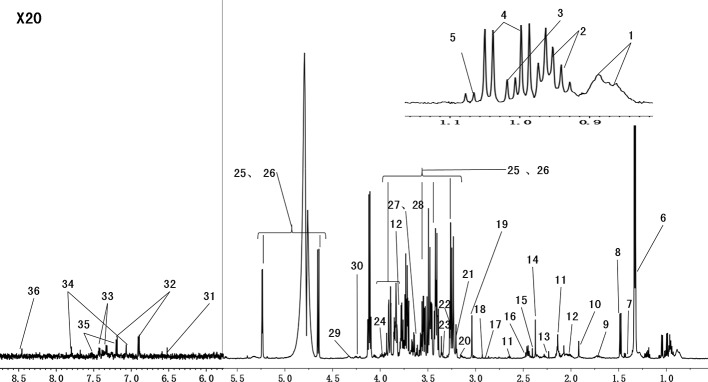
Figure 4.
Representative 600 MHz 1H-CPMG NMR spectra (δ 0.5–4.6, δ 5.2–9.0) of serum from the normal groups. The spectra illustrate the majority of the metabolites in this experiment. We marked the metabolites from the relevant peaks of different chemical shifts, which were based on the previous literature and an in-house NMR database. There were 36 metabolites in the serum samples (1, HDL\LDL; 2, isoleucine; 3, leucine; 4, valine; 5, isobutyrate; 6, lactate; 7, lysine; 8, alanine; 9, arginine; 10, acetate; 11, glutamate; 12, glutamine; 13, acetone; 14, pyruvate; 15, succinate; 16, methionine; 17, N,N-dimethylglycine; 18, creatinine; 19, creatine; 20, choline; 21, phosphorylcholine; 22, malate; 23, taurine; 24,betaine; 25, β-glucose; 26, α-glucose; 27, glycine; 28, glycerol; 29, threonine; 30, myoinositol; 31, fumarate; 32, tyrosine; 33, phenylalanine; 34, histidine; 35, trypotophan; 36, formate).

