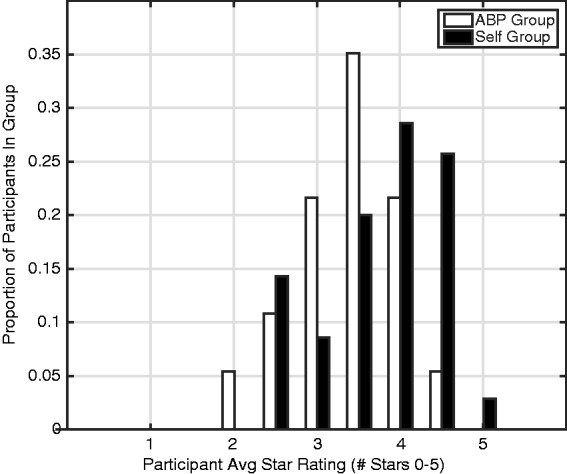
Figure 16.

Distribution of star ratings for the ABP (white) and Self (black) groups. The bars of the histogram represent the proportion of listeners in each group whose average star rating falls in each of 11 bins that are equally spaced from 0 to 5 stars in steps of 0.5. ABP = Audiologist Best Practices.
