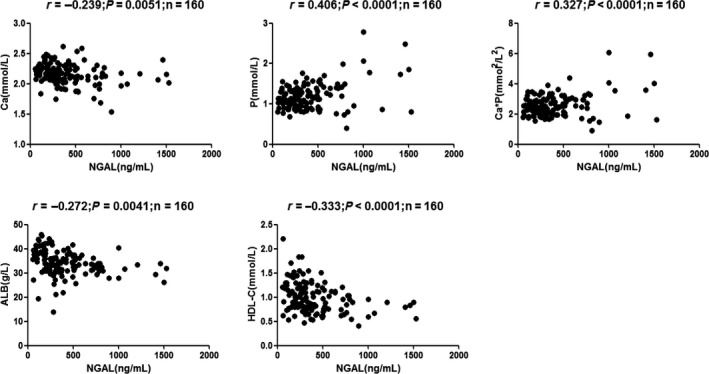
Figure 3.

Correlation analyses among the tested parameters in chronic kidney disease (CKD) patients. Correlations were analyzed between (A) neutrophil gelatinase‐associated lipocalin (NGAL) and calcium (Ca) (r = −0.239, P = 0.0051), (B) NGAL and phosphorus (P) (r = 0.406, P < 0.0001), (C) NGAL and calcium*phosphorus (Ca*P) (r = 0.327, P < 0.0001), (D) NGAL and albumin (ALB; r = −0.272, P = 0.0041), and (E) NGAL and high‐density lipoprotein cholesterol (HDL‐C; r = −0.333, P < 0.0001).
