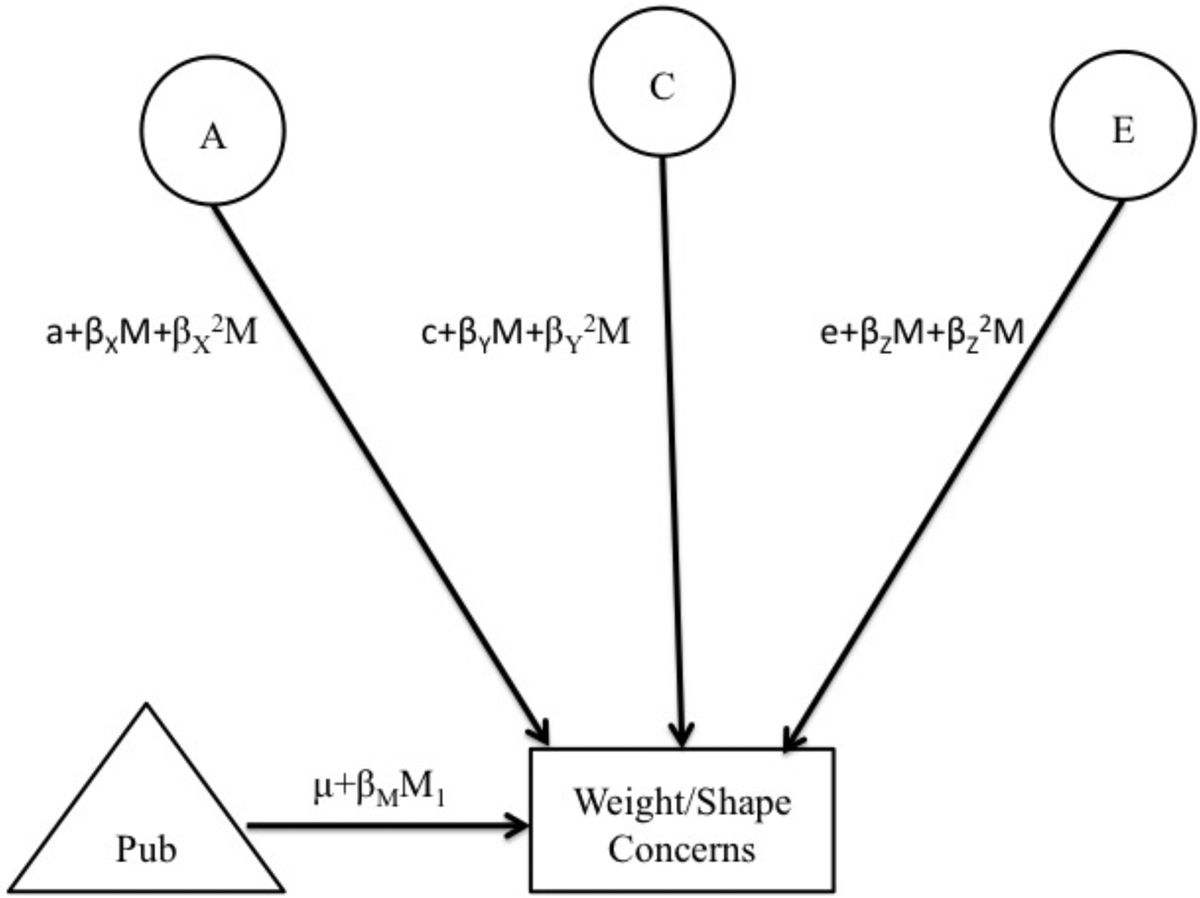
Figure 1. Path Diagram for the Full Moderation Model and Extended Moderation Model for One Twin Only.

Abbreviations include: Pub = puberty; A = additive genetic effects; C = shared environmental effects; E = non-shared environmental effects; M1 and M2 =moderator for twin 1 and twin 2, respectively; βM = phenotypic regression coefficient; a, c, and e = paths or intercepts; βX, βY, βZ = linear moderators; βX2, βY2, βZ2 = quadratic moderators. The model is depicted for only one twin, but parameters are fit separately for MZ and DZ twins.
